Enterohemhorrhagic Escherichia Coli O157:H7 Initial Adherence and Interactions with Polymeric Immunoglobulin Receptor
Info: 52324 words (209 pages) Dissertation
Published: 25th Feb 2022
Tagged: Biomedical Science
ENTEROHEMHORRHAGIC ESCHERICHIA COLI O157:H7 INITIAL ADHERENCE FACTORS AND INTERACTIONS WITH THE POLYMERIC IMMUNOGLOBULIN RECEPTOR DURING ADHERENCE TO INTESTINAL EPITHELIAL CELLS
Abstract
Escherichia coli O157:H7 is the most notorious and well-studied serotype of the enterohemorrhagic E. coli (EHEC) class of E. coli intestinal pathogens. E. coli O157:H7 and other EHEC strains are responsible for multiple outbreaks across the world each year, with those afflicted suffering mainly from diarrhea, vomiting, and hemorrhagic colitis; a substantial fraction of those infected require hospitalization. Serious complications like hemolytic uremic syndrome (HUS) contribute to the significant morbidity and mortality caused by EHEC infection. Virulence varies greatly across outbreak strains and much remains to be studied regarding EHEC pathogenesis. E. coli O157:H7 remains a relevant foodborne pathogen due in part to its complexity and variety of virulence factors. Adherence mechanisms are a critical component of pathogenesis, persistence in natural reservoirs, and environmental contamination. E. coli O157:H7 has a highly effective adherence operon (the LEE-Locus of Enterocyte Effacement) and its encoded intimate adherence mechanism is well characterized. However, factors involved in initial attachment are not well understood and adhesins provide potential targets for intervention and treatment strategies.
In this study, we describe several factors involved with the initial adherence of E. coli O157:H7 in vitro. Primarily, we describe a bacterial protein not previously reported to be involved in adherence, Slp (starvation lipo-protein); and its interactions with the human host protein polymeric immunoglobulin receptor (pIgR). Following the observation of significant colocalization phenotypes by immunofluorescence microscopy, a co-immunoprecipitation (Co-IP) assay was done with a human recombinant Fc-tagged pIgR protein and E. coli O157:H7 proteins, which led to the identification of a bacterial protein (Slp) attaching to the pIgR. Slp is a small lipoprotein found in E. coli and Shigella species. Disruption of Slp expression through deletion of its encoding gene slp in E. coli O157:H7 produced a significant adherence deficiency to Caco-2 cells, especially at early time points associated with initial adherence. Plasmid complementation of the slp gene fully restored the wild-type phenotype Furthermore, immunofluorescence microscopy revealed evidence that this interaction is specific for extra-intestinal pathogenic strains of E. coli and specific for adherence to human colonic cells in vitro. Additionally, deletion of slp gene resulted in the absence of the corresponding protein band in further Co-IP assays, with the slp complemented mutant strain restored the wild-type binding behavior. These data support the proposition that Slp significantly and directly contributes to initial adherence, with the pIgR protein as its proposed receptor.
Table of Contents
Click to expand Table of Contents
List of Abbreviations
Chapter 1: Literature Review
1.1. Pathogenic Escherichia coli
1.2. Clinical Presentation and Outbreaks
1.3. Molecular Pathogenesis
1.4. Genetics
1.5. Expression of Virulence and Adherence Factors
1.6 Acid Resistance and Gene Regulation
1.7. The Polymeric Immunoglobulin Receptor (pIgR)
1.8. Bovine Hosts and EHEC
Chapter 2: Materials and Methods
Table 2.1. Bacterial Strains and Plasmids
2.2. Cell Culture and Media
2.3. Infection
2.4. Microscopy
2.5. Adherence
2.6. RNA Preparation
2.7. Quantitative PCR (qPCR)
2.8. RNA Sequencing
2.9. Gene Deletions and Complementations
Table 2.2. Primer Sequences
2.10. Co-immunoprecipitation (Co-IP) and Protein Gels
2.11. Protein Identification
Chapter 3: pIgR and Slp
3.1. Introduction
3.2. Results
3.3. Discussion
Chapter 4: RNA Sequencing and Gene Deletions
4.1. Introduction
4.2. Results
4.3. Discussion
Chapter 5: Summary and Future Directions
5.1. Summary and Future Work
Appendix
Appendix A. Additional Materials and Methods
Appendix B. Colocalization and Statistics
Appendix C. List of 686 genes upregulated in E. coli O157:H7 during adherence to Caco-2 cells.
References
List of Figures
Figure 3.1. Initial Adherence Timeline in E. coli O157:H7
Figure 3.2. Colocalization and Covariance of pIgR with E. coli K12 and E. coli O157:H7 Over Time
Figure 3.3. Colocalization and Covariance of pIgR with Pathogenic E. coli Strains
Figure 3.4. Relative Gene Expression Profiles and Growth Rates of ……..???
Figure 3.5. Co-immunoprecipitation of E. coli O157:H7 Proteins With Human Recombinant Fc-Tagged pIgR Protein
Figure. 3.6. Co-Immunoprecipitation of Fc-Tagged pIgR Protein with E. coli O157:H7 Δslp and E. coli O157:H7 Δslp(pKD3::slp) Strains
Figure 3.7. Colocalization and Covariance of pIgR with E. coli O157:H7 Δslp and E. coli O157:H7 Δslp(pKD3::slp) Strains
Figure 3.8. Adherence of E. coli Strains (what strains??) to Caco-2 Cells
Figure 3.9. Bovine Intestinal Cells and the pIgR (should be more descriptive)
Figure 4.1. Heat Map of E. coli O157:H7 Gene Expression During Initial Adherence
Figure 4.2. Quantitative Adherence and Growth Curves of E. coli O157:H7 Strains
List of Tables
Table 1.1. Select Signals Affecting Virulence Gene Expression in E. coli O157:H7 Within the Host
Table 1.2. AFI???? Genes
Table 2.1. Bacterial Strains and Plasmids used in the Study
Table 2.2. Primer Sequences Used in the Study
Table 3.1. Protein Identification Using LC MS/MS???
Table 4.1. Genes Upregulated in E. coli O157:H7 Adhered to Caco-2 Cells
List of Abbreviations
AFI: Acid fitness island
AR: Acid resistance
Co-IP: Co-immunoprecipitation
EHEC: Enterohemorrhagic Escherichia coli
IEC: Intestinal epithelial cell
LC MS/MS: Liquid chromatography tandem mass spectroscopy
LEE: Locus of enterocyte effacement
MOI: Multiplicity of infection
pIgR: polymeric immunoglobulin receptor
pIgR-Fc: Fc-tagged human recombinant polymeric immunoglobulin receptor protein
RAJ: recto-anal junction
RSE: Recto-anal junction squamous epithelial cells
T3SS: Type III secretion system
Chapter 1: Literature Review
1.1. Pathogenic Escherichia coli
1.1.1. Identification of Escherichia coli and its Pathogenic Varieties (Pathovars)
In 1885, German physician and bacteriologist Theodor Escherich first described a bacterium isolated from the digestive tracts of ill children, which he called Bacillus communis coli. In 1919, after his death, it was renamed Escherichia coli to acknowledge Escherich’s contributions to bacteriology. Because of its easy propagation and versatility in the laboratory, it has become one of the most widely studied and well-characterized bacterial species and is considered a model organism in microbiology. Most E. coli strains are harmless or beneficial commensal gastrointestinal (GI) organisms in the microflora of humans and animals, but there are pathogenic varieties. Pathogenic E. coli can be classified as either extraintestinal (ExPEC) or diarrheagenic pathotypes. ExPEC cause diseases outside of the GI tract, such as urinary tract infections and neonatal meningitis, while diarrheagenic E. coli cause a spectrum of GI illnesses (Stenutz, Weintraub, & Widmalm, 2006). Currently, there are five commonly referenced classifications of diarrheagenic E. coli: enteropathogenic E. coli (EPEC), enteroaggregative E. coli (EAEC), enteroinvasive E. coli (EIEC), enterotoxigenic E. coli (ETEC), and enterohemorrhagic E. coli (EHEC) (Clements, Young, Constantinou, & Frankel, 2012) [Pangenome Structure of Escherichia coli 2008]?? Several other unstandardized classifications have come into use, such as diffusely adherent E. coli (DAEC) and adherent invasive (AIEC) (Croxen et al., 2013). The EHEC classification is used to describe a subset of diarrheagenic E. coli pathovars that produce hemorrhagic colitis during infection. In literature, it is common to see enterohemorrhagic E. coli (EHEC), Verotoxin-Producing E. coli (VTEC), and Shiga Toxin-Producing E. coli (STEC) used interchangeably; however, these terms may sometimes be used to denote subtle differences between pathovars. For the purposes of
1.1.2. EHEC Biology and Characteristics
E. coli is a species within the family Enterobacteriaceae, a common family in the intestinal microflora. Like all E. coli, EHEC serotype O157:H7 is Gram-negative, facultatively anaerobic, motile, and stress tolerant (Croxen et al., 2013). It is also metabolically versatile, which allows it to survive and/or grow in harsh habitats with a variety of challenges (nutrient and oxygen-poor conditions, low temperature, low pH, exposure to antimicrobial agents, etc.). Conversely, this bacterium is well-adapted to thrive in a variety of host environments while competing with commensal organisms and immune responses. E. coli O157:H7 is also able to produce anti-microbial compounds, such as colicins that inhibit the growth of competing bacterial species (including other E. coli) creating additional survival and growth advantages.
Among other characteristics as a Gram-negative species, the E. coli O157:H7 cell membrane is composed of peptidoglycan and lipopolysaccharide (LPS or endotoxin). The combined membrane structure is composed of three different layers: the cytoplasmic or inner membrane (IM), the peptidoglycan layer, and the outer membrane (OM) (Chatterjee & Chaudhuri, 2012). The IM layer is composed of a phospholipid bilayer adjacent to the cytosol, with assorted trans-membrane proteins. The peptidoglycan layer is located in the periplasmic space, between the IM and OM (Schwechheimer & Kuehn, 2015). The OM is also a bilayer, with the periplasm-adjacent layer being composed of phospholipids like those found in the IM, but also containing three components of LPS: lipid A, the core polysaccharide region, and the O antigen polysaccharide chains (Chatterjee & Chaudhuri, 2012). Lipid A, which serves as an anchor for the core polysaccharides and O antigens, is highly conserved among E. coli strains, and is the toxic component of endotoxin (Frirdich & Whitfield, 2005). The core region of the OM is responsible for maintaining a barrier between the cell’s interior and its environment, with some specific subtypes being associated with higher virulence. The O antigens share a basic structure, but contain enough variability to be used to classify E. coli strains using serology. O antigens are chains of approximately 10 to 25 repeating sugar residues, with a range of two to seven residues in a chain (Stenutz et al., 2006). The type (or absence) of the H antigen (flagellar proteins) is combined to define E. coli serotypes using the Kauffman method. Anti-sera that contain antibodies specific for each O and H antigen will agglutinate in a positive reaction, and the specificity of antibody-based identification makes serotyping a useful method for identifying unknown isolates and tracking outbreaks, but are also crucial in the study of virulence (Croxen et al., 2013) (Clements et al., 2012)
1.1.3. E. coli O157:H7 and Non-O157 EHEC Serotypes
E. coli O157:H7 was declared a nationally reportable food contaminant in the United States by the United States Department of Agriculture (USDA) in 1993, after a large outbreak linked to undercooked beef in fast-food restaurants. E. coli O157:H7 remains one of the most prominent causes of E. coli outbreaks, but six other EHEC serogroups have been significant causes of illness as well and are now tracked along with E. coli O157:H7: O26, O111, O103, O121, O45, and O145 (Hegde et al., 2012). Study of EHEC strains shows distinct clusters of more closely-related serotypes within the classification. It is highly likely that
1.2. Clinical Presentation and Outbreaks
1.2.1. Clinical Presentation and Symptoms
After ingestion, symptoms of EHEC infection can take 1-3 days to manifest, and can be incited by the ingestion of as few as 100 bacterial cells (Melton-celsa, Mohawk, Teel, & Brien, n.d.) (Gyles, 2007). Characterized mainly by symptoms of watery diarrhea and hemorrhagic colitis, infection can also present with abdominal cramping, headache, nausea, vomiting, and fever (Hunt, 2010). Many cases require hospitalization and the infection can progress to much more serious complications. EHEC infection can strike anyone, but the most serious sequelae are primarily in children under the age of five, the elderly, and immunocompromised individuals (Mohawk & O’Brien, 2011) (Smith, Fratamico, & Gunther, 2014). According to data collected prior to 2013, 4% of overall confirmed E. coli O157:H7 cases in the U.S. progressed to hemolytic uremic syndrome (HUS), while 14% of children under the age of ten developed HUS (Croxen et al., 2013). The national mortality rate in the United States for all patients is 0.5%, while children under the age of ten had an increased mortality rate of 1-4% (Croxen et al., 2013). HUS is a serious complication resulting in kidney damage and is characterized by acute renal failure, thrombocytopenia, and microangiopathic hemolytic anemia (Farfan & Torres, 2012)(Nguyen & Sperandio, 2012). In addition to Stx, LPS is found in the bloodstream and causes an acute inflammatory response, causing upregulation of proinflammatory cytokines and chemokines (Melton-celsa et al., n.d.). LPS is the only known ligand of Toll-like receptor 4 (TLR4), which upregulates the expression of NF-κB. NF-κB is a major transcriptional regulator in innate immunity, and the resulting increased production of proinflammatory chemokines and cytokines results in significant exacerbation of cellular and tissue pathology. This outcome is the primary reason antibiotics are not recommended for E. coli infection, as increased levels of LPS contribute to thrombosis, apoptosis, and tissue necrosis; antibiotic treatment is associated with higher risk for developing HUS and other serious sequelae (Melton-celsa et al., n.d.). Additionally, cases of permanent neurological damage and an association with increased risk for long-term complications, such as diabetes have also been reported (Caprioli, Scavia, & Morabito, 2013).
1.2.2. Outbreaks
To estimate the public health burden, it’s important to note that not all cases are reported. In the United States, E. coli O157:H7 has been responsible for more than 350 outbreaks between 1982 and 2002, and 255 outbreaks between 2003 and 2012 (Rangel, Sparling, Crowe, Griffin, & Swerdlow, 2005) (Heiman, Mody, Johnson, Griffin, & Gould, 2015). Between 17-30% of the reported illnesses resulted in hospitalizations, with 1-2% progressing to HUS, and 0.4-0.7% ended in death. Additionally, the National Outbreak Reporting System estimated over 100 EHEC outbreaks in the United States in 2009 to 2010 alone, indicating that the true number of EHEC illnesses and its public health burden is extremely underestimated (Heiman et al., 2015) (Hegde et al., 2012)(Hall et al., 2013). By itself, E. coli O157:H7 poses a significant health burden worldwide and considering the recent estimates have stated that up to 70-80% of EHEC infections are non-O157 isolates, all current EHEC cases combined constitute an underestimated and significant source of morbidity and mortality.
E. coli O157:H7 was first recognized as an outbreak-causing pathogen in 1982, after an outbreak occurred in the United States due to undercooked hamburger meat (Rangel et al., 2005), but was not made a nationally reportable pathogen until after a large multi-state outbreak in 1993 (Rangel et al., 2005). As was the 1982 outbreak, the 1993 source was undercooked beef from fast-food chain restaurants, which was linked to cases in four Midwestern states and sickened more than 700 people, with over 150 people requiring hospitalization. Approximately 7.5% of cases developed HUS, with some cases resulting in permanent kidney or brain damage, and there were four deaths (Rangel et al., 2005). As a result of this outbreak, E. coli O157:H7 became a nationally reportable food contaminant by the USDA, and also upgraded the recommended internal temperature for cooked hamburgers from 140 °F (60 °C) to 155 °F (68 °C). By the year 2000, 48 states required mandatory reporting of contamination with E. coli O157:H7.
In 2006, a highly publicized outbreak involving fresh spinach occurred, affecting 26 states, and was likely due to the proximity of the spinach fields to a cattle ranch which tested positive for O157:H7 during the investigation. Over 200 cases were reported, with three confirmed deaths linked to the outbreak.
In 2011, a unique and highly virulent non-O157 strain of STEC caused a large outbreak in Germany. The E. coli serotype O104:H4, which involved in this outbreak infected almost 4,000 people and had a significantly higher proportion of cases developing HUS as well as a significantly higher rate of mortality. The identified strain of E. coli O104:H4 was a unique isolate due to high virulence and the lack of the intimin/tir adherence system, which led to categorize it as an EAEC instead of an EHEC strain. However, the ability of this isolate to produce Shiga toxin, a trait not characteristic of EAEC, contributed to its virulence. The appearance of this seemingly hybrid strain of pathogen raised many concerns and questions that are still being investigated.
At the time of this publication in July 2018, (at the time of this publication in July 2018)?? there is an ongoing multi-state outbreak of E. coli O157:H7 from contaminated Romaine lettuce. The Centers for Disease Control and Prevention (CDC), the U.S. Food and Drug Administration (FDA), several state organizations announced on April 10th, 2018 that there were reports from multiple states of confirmed E. coli O157:H7 infection linked to Romaine lettuce harvested in the Yuma region of Arizona [CDC]. As of early May, this outbreak has caused reported illnesses of 172 people in 32 states, with 75 hospitalizations and one death. Of the hospitalized cases, 20 people developed HUS.
1.3. Molecular Pathogenesis
1.3.1. Ingestion and Acid Resistance
One of the most important factors in E. coli O157:H7 virulence is its acid tolerance. The primary acid resistance (AR) system used by E. coli O157:H7 (Gad system) is a major player in virulence and adherence gene regulation (see section 1.6. on acid resistance and gene regulation), and the AR functions are thought to be primarily responsible for the impressively low infectious dose required for successful infection. While other enteric bacterial pathogens, such as non-typhoidal Salmonella and Vibrio cholerae have infectious doses between 105 to 109 cells, respectively; E. coli O157:H7 and some Shigella species have very effective mechanisms of acid tolerance and have infectious doses as low as ~100 bacterial cells or colony-forming units (Lin et al., 1996). The human stomach has an average pH between 1.5 to 2.5, which is below the threshold required for protons to leak through the membrane into a bacterial cell (Zhao & Houry, 2010). When the internal pH reaches approximately 4.5, the cell loses its transmembrane electrical potential, resulting in a disastrous inability to import or export anything across the cell membrane, eventually causing death. This pH range also causes damage to cellular components, such as proteins and enzymes (Tramonti, De Canio, Delany, Scarlato, & De Biase, 2006). In E. coli O157:H7, acid stress is mainly handled by one of three AR systems (AR1-AR3). The AR2 (Gad) and AR3 (Adi) are more crucial and consisted of highly effective amino acid decarboxylase/antiporter systems (Foster, 2004) (Zhao & Houry, 2010).
AR1, also known as the glucose-repressed or oxidative AR system, is not well characterized but appears to be less critical than the decarboxylase systems. AR1 study is limited but has been described as active in bacteria that have been cultured in media buffered to pH 5.5, then challenged with pH 2.5. AR1 allows the adapted bacteria to survive an acid challenge that would kill un-adapted bacterial populations (Foster, 2004). Both the cAMP receptor protein (CRP) and alternative sigma factor S (σS) are required for its activation (Foster, 2004). However, its relationship to virulence or adherence is currently unknown.
AR2, more commonly known as the Gad system, is a glutamate decarboxylase/antiporter system whose function is to use up an intracellular proton in each decarboxylase reaction and export it from the bacterial cell, ultimately resulting in increased internal pH. The Gad system has three functional components: glutamate decarboxylases, antiporters, and transcription regulation. GadA and GadB are both glutamate decarboxylase enzymes, GadC is the glutamate/ γ-amino butyric acid (GABA) antiporter, and GadE is the system expression regulator (Foster, 2004). The reaction occurs as follows (Zhao & Houry, 2010):
GadA or GadB
 (COO–)–CH–(NH3+)–CH2–CH2–(COO–) + H+ (NH3+)–CH2–CH2–CH2–(COO–) + CO2
GABA
Glutamic Acid
AR3, the Adi system, is an arginine decarboxylase/antiporter system that functions by the same mechanism shown above. It is not as thoroughly studied, as it seems less critical than the Gad system. AdiA is the arginine decarboxylase, AdiC is the arginine/agmatine antiporter, and AdiY is a system regulator (Foster, 2004).
There are other putative AR systems in E. coli, but are not well characterized, and their role in E. coli O157:H7 pathogenesis is unknown.
1.3.2. Adherence
In order to produce the fully virulent classic presentation of severe intestinal pathology that EHEC is known for, several robust virulence factors, namely the LEE encoded adherence and virulence effectors and Stx, are utilized by EHEC. EHEC forms a particularly strong bond with the host cell using its adhesin intimin (encoded by the gene eae) and the translocated intimin receptor, Tir. The genes encoding intimate adherence components are located on the LEE pathogenicity island. Intimate adherence is only possible after the bacterium is able to establish an initial attachment allowing it to stay stably adjacent to the host cell.
To initiate and establish intimate adherence, and also to translocate other virulence effectors, the EHEC bacterial cell assembles a type III secretion system (T3SS). The T3SS functions by directly injecting factors through the host cell membrane into the cytosol (Schmidt, 2010). The proteins necessary to assemble the T3SS are located on the LEE operon. The main components of the assembly itself include the proteins EscR, S, T, U, and V (the base spanning the bacterial inner membrane); Esc J, C, and F (which span the periplasmic space and the bacterial outer membrane); EspA (the ‘needle’ filament); and EspD/B (which spans the epithelial cell membrane). The system is powered through EscN, an cytoplasmic ATPase (Garmendia, 2005). Once the cell membrane of the host intestinal epithelial cell (IEC) has been breached, EHEC injects effector proteins into the IEC. E. coli secreted effector proteins (Esps) have a variety of functions involved in manipulating eukaryotic cell signaling pathways to further facilitate bacterial adherence and colonization (Brady et al., 2011). Many effector proteins have overlapping and redundant functions, and EHEC translocates about twice as many effectors as the LEE-positive pathotype EPEC does (Croxen & Finlay, 2010). The main LEE-encoded effectors are: Tir, Map, EspF, EspG, EspH, EspB, and Intimin (Wong et al., 2011). Tir and intimin are crucial for intimate adherence because they are the adhesin/ligand that allow the EHEC to bind tightly to the IEC surface. Tir, the translocated intimin receptor, is the most well-characterized adhesion factor of EHEC and is the receptor for the bacterial cell-surface adhesin intimin. Tir is injected into the host epithelial cell through the T3SS, where it then localizes to the epithelial cell membrane. It assembles and functions as a dimer, and each dimer is able to bind to other Tir dimers, which allows for tight clustering of receptors, resulting in for multiple strong adhesion points between the bacterium and the epithelial cell (Garmendia, 2005). The intracellular portion of Tir also interacts with the host cytoskeleton, resulting in actin accumulation directly below the bacterium, contributing to the characteristic pathology seen in EHEC infections (Garmendia, 2005).
1.3.3. Attaching and Effacing Lesions and Shiga Toxins
Presentation of EHEC infection involves the formation of attaching and effacing (AE) lesions, which is characterized by the loss of normal, healthy microvilli structures on the IEC, caused by microvilli effacement and pedestal formation by virulence effectors. The reorganization of host actin cytoskeletal structure destroys the brush-border microvilli, and replaces it with a pedestal on which the adhered bacterium takes up residence (Nguyen, Sperandio, Padola, & Starai, 2012). Another effector protein, Map (mitochondrion-associated protein), functions in three ways: first, it causes mitochondrial damage and dysfunction by interfering with the maintenance of mitochondrial membrane potential; second, it forms transient filopodium-like structures, and third, it is required for disruption of tight junctions (TJs) resulting in compromised intestinal barrier functions (Garmendia, 2005). Map mutants showed attenuated virulence and decreased ability to compete with wild type strains in vivo. EspF is involved in many different pathways, including parallel functions of mitochondrial dysfunction displayed by Map. EspF triggers actin assembly, promotes degradation of anti-apoptotic proteins, inhibition of non-opsonized phagocytosis, inhibition of ion transport leading to compromised intestinal barrier function (thought to be a direct cause of diarrhea), and apoptosis (Wong et al., 2011). EspG is involved with the degradation of microtubules and the formation and accumulation of actin stress fibers, thus aiding the formation of pedestals. EspH also inhibits phagocytosis and aids in formation of actin pedestals, and functions by inhibiting Rho GTPases, which in turn inhibits actin cytoskeletal rearrangement necessary to engulf the bacterium. EspB is involved in actin cytoskeletal rearrangement and promotion of a hospitable environment for the attaching bacterium, by binding host factors involved in cytoskeletal modulation and inhibition of proteins with the potential to reduce T3SS effectiveness (Wong et al., 2011).
Many effector proteins get translocated by theT3SS; however not all of them are encoded in the LEE. Effector proteins encoded elsewhere in the genome include Esp1 (NleA- non-lee encoded effector A), EspJ, EspM, EspT, EspV, an assortment of Nle proteins, and Tccp/EspFu (Wong et al., 2011). One of the first identified non-LEE encoded effector proteins was Orf3, which is an EspG homologue (Dean, Maresca, & Kenny, 2005). Esp1/NleA is responsible for inhibition of protein exportation from the host cell’s endoplasmic reticulum (ER), and aids in TJ dysfunction. EspJ inhibits bacterial phagocytosis, EspM increases epithelial stress fiber formation, and EspT and EspV both aid in the modulation of the actin cytoskeleton. Nle proteins including but not limited to NleD, E, F, H, and K are involved in inhibition of NF-κB activation and other cell signaling pathways (Wong et al., 2011). Tccp/EspFu (Tir-cytoskeletion coupling protein) is the main factor for producing pedestal formation and serves as the link between Tir and the actin cytoskeleton. It functions by inhibiting the auto-inhibition of pathways that inhibit actin polymerization, thus allowing rearrangement and polymerization into a pedestal. It also aids in colonization and AE lesion formation, but is not required for either (Wong et al., 2011).
AE lesions and other pathology caused by EHEC are significantly enhanced by Shiga toxins. EHEC strains can contain variants of one or both Stx types (Stx1 and Stx2) in any combination and the following description applies generally to all variants. Shiga toxins are structured as AB5 toxins, consisting of one A subunit with enzymatic toxic activity, plus five identical B subunits in a circular pentamer. The B subunit ring binds to cell-surface receptors and creates a pore in the epithelial cell membrane, which then allows the A subunit to enter the cytosol and execute its enzymatic functions. The Stxa subunit (referring to both Stx1 and Stx2 variants) is an RNA N-glycosidase, which functions by cleaving an adenine residue from domain VI of 28S ribosomal RNA in eukaryotic cells. Cleavage at this site inhibits amino-acyl tRNA binding, thus preventing amino acid chain elongation, resulting in an inhibition or halt of protein synthesis in the cell leading to apoptosis (Johannes & Römer, 2010). Stx binds the cell surface receptor 3 (Gb3), which is expressed on Paneth cells in the large intestine and on epithelial cells in the kidneys (Johannes & Römer, 2010). The exact mechanism(s) by which Stx enters the bloodstream is not entirely clear, though it is generally accepted that the main mechanism involves being taken up into the cell, followed by retrograde transport and enzymatic activation. When the Stx AB5 complex binds to the surface of the epithelial cell, it will induce one of several mechanisms in order to be taken up by the cell (Johannes & Römer, 2010). Stx induces endocytosis by clathrin-coated pits, however clathrin-coated pits are not required and the absence of them does not inhibit Stx uptake. Stx will engage in retrograde transport by localizing to early endosome, then transferring to the Trans-Golgi Network (TGN), then to the ER. While Stx is in the early endosome, it undergoes an enzymatic cleavage resulting in two components: a catalytic A1 subunit with RNA N-glycosidase function, and a complex of B5 subunits plus the A2 subunit. These fragments are not separated until reaching the ER, where the A1 subunit undergoes retrograde transport into the host cell cytosol where it will execute its functions (Johannes & Römer, 2010).
Stx has more diverse effects than protein synthesis inhibition in epithelial cells. Stx-mediated damage to the vasculature leads to hemorrhagic colitis, which then exposes bacteria in the intestine to the rich nutrients and growth promoters available from the blood. Stx also causes an increase in epithelial cell expression of nucleolin, a cell surface protein that can bind to intimin, which gives an advantage of increased intimate adherence during infection (Robinson, Sinclair, Smith, & O’Brien, 2006). The effect of Stx on immune function is less clear, with conflicting evidence of both pro- and anti-inflammatory effects. Some reports state that Stx induces the release of pro-inflammatory cytokines from macrophages and monocytes, which then leads to an increase of Gb3 expression on epithelial cells in the intestine. Other postulated pro-inflammatory effects include cytokine secretion and increased expression of IL-8 (Pacheco & Sperandio, 2012). Other reports have speculated that either Stx or other effectors downregulate factors involved in inflammation (Pacheco & Sperandio, 2012).
1.3.4. Treatments and Resolution of Infection
In cases of EHEC infection that do not progress to HUS, symptoms generally resolve in five to seven days. Treatment for EHEC infection is limited to supportive/rehydration therapy, due to the adverse effects of antibiotic treatment. Many alternative therapies have been explored, but none have shown to be significantly effective in humans, and no human vaccines currently exist. Some treatments have been effective to varying degrees in animal models of infection: for example, Stx2 antibodies increased the rate of survival in experimentally infected gnotobiotic piglets, and the administration of the probiotic species Lactobacillus casei demonstrated some protection against toxins in experimentally infected infant rabbits (Rahal, Kazzi, Nassar, & Matar, 2012), but no significant advances have been made in safe, effective treatments in human infection.
1.4. Genetics
1.4.1. E. coli O157:H7 Genome
The E. coli O157:H7 genome is approximately 5.5 Mb in size; large in comparison to nonpathogenic E. coli strain K12 MG1655 at only 4.6 Mb. E. coli O157:H7 contains a highly conserved 4.1 Mb backbone sequence observed in all E. coli strains, with its additional sequences shown to be specific to E. coli O157:H7 or EHEC strains and largely contain genes likely to have been obtained by horizontal gene transfer or are of phage origin. Many of these acquired sequences are pathogenicity islands and contain virulence genes and operons. E. coli O157:H7 contains many different defined and putative genes contributing to its pathogenicity through survival and fitness, adherence, and virulence. Highlighted here is an overview of several of the most characteristic and important genes responsible for EHEC’s high virulence and unique pathogenesis.
1.4.2. The Locus of Enterocyte Effacement (LEE) Operon
The Locus of Enterocyte Effacement (LEE) operon is one of the most notorious features of EHEC and EPEC pathovars. The genomic pathogenicity island (PI), found in both EHEC and EPEC pathovars, is approximately 43 kb and contains more than 40 genes organized into five operons (Ji Youn Lim, Jang W. Yoon, 2013). Although EPEC carries this PI, the LEE operon in E. coli O157:H7 has an additional 7.5 kb of uncharacterized sequence that EPEC strains do not have (Lim, Yoon, & Hovde, 2010). The LEE is critical for the formation of severe attaching and effacing (A/E) lesions and the microvilli effacement associated with pedestal formation; hallmarks of EHEC infection (Dean et al., 2005). The gene products can be divided into categories- the type three secretion system (T3SS), intimate adherence factors intimin (adhesin) and its receptor Tir (the translocated intimin receptor), and other secreted virulence effectors (Gyles, 2007). In the first operon LEE1, the ler gene encodes the LEE-encoded regulator Ler, which is considered the master regulator of the entire PI. Although many other regulatory factors have been shown to effect LEE, Ler remains the primary control, with many of the LEE-effecting regulators acting through it indirectly (Nguyen et al., 2012).
1.4.3. Plasmid pO157
The pO157 plasmid is a 92-kb plasmid, with 100 open reading frames (ORFs) encoding many of the virulence genes utilized by E. coli O157:H7 (Landstorfer et al., 2014) (Ji Youn Lim, Jang W. Yoon, 2013). Several ORFs of note include hemolysin, a type 2 secretion system (T2SS), and a putative virulence factor ToxB. Hemolysin is a pore-forming cytolysin toxin responsible for lysing erythrocytes; encoded by the hly genes (Burgos & Beutin, 2010). The T2SS, encoded by etp genes, secretes a variety of virulence effectors and is required for full virulence and adherence to HeLa cells in vitro (Ho, Davis, Ritchie, & Waldor, 2008). The toxB is a gene of interest in the study of adherence and virulence. It has some sequence similarity to toxin B in Clostridium difficile, and efa-1/lifA found in other pathogenic E. coli strains. It is proposed to contribute to Caco-2 cell adherence through increased activity of the T2SS, but may also have some function in inhibiting lymphocytes (Ji Youn Lim, Jang W. Yoon, 2013). The pO157 plasmid contains many other ORFs relevant to E. coli O157:H7 virulence and its full role in pathogenesis is not yet known.
Large plasmids similar to the pO157 have been observed in many non-O157 EHEC strains, varying in size from about 70 to 200 kb. Most of these reported plasmids carry the genes for hemolysin (hly), but other known pO157 encoded virulence factors are not similarly conserved. Although the presence of hemolysin is associated with a higher risk of developing HUS, the uncharacterized non-O157 plasmids otherwise have unknown contributions to virulence and adherence (Lim et al., 2010).
1.4.4. Shiga Toxins
Shiga toxins (Stx) are produced by Shigella dysenteriae and EHEC. The stx genes were acquired by horizontal gene transfer, and the phage genome was integrated into the bacterial chromosome. The stx genes are encoded by two lambda phage genomes, 933W and 933J (Mora et al., 2004). There are multiple subtypes: the two main classes are Stx1 and Stx2. Stx1 is nearly 100% homologous to Stx from S. dysenteriae, while being only 55% homologous to Stx2 though they share the same mechanism of action (Pacheco & Sperandio, 2012). Stx1 has three variants: Stx1, Stx1c, and Stx1d. Stx2 has a larger number of variants: Stx2c, Stx2c2, Stx2e, and Stx2f. These variants can be found in any combination in any EHEC strain; however, strains containing only Stx2 variants are associated with higher virulence than strains containing only Stx1 or Stx1 and Stx2 variants (Johannes & Römer, 2010). These genes can be found together or separately and can also be differentially regulated. The stx genes are upregulated in response to a variety of environmental and host signals, including iron concentration, stress response, pH, host hormones, and antibiotics (Kimmitt, Harwood, & Barer, 2000).
1.5. Expression of Virulence and Adherence Factors
1.5.1. Overview of Virulence Gene Regulatory Signals
Molecular pathogenesis in E. coli O157:H7 is a tightly controlled series of steps, which is regulated by a series of host and environmental signaling factors encountered during its passage through the GI tract. Brief highlights of signals and their effects are shown in Table 1.1.
Table 1.1. Select Signals Affecting Virulence Gene Expression in E. coli O157:H7 Within the Host
| GI Tract Location | Host/ Environmental Signal | Effect on Virulence Factors | Effect in Pathogenesis |
| Stomach | |||
| Low pH | ↑ AR
↑ gadE ↑ GadE (represses ler) ↑fli, flh, flg (flagellar genes) |
↑ Acid resistance (survival)
↓ of LEE ↑ Motility |
|
| Small Intestine | |||
| Bile | ↑ acrAB | ↑ Bile resistance | |
| AI-3 | ↑ QseC (promotes ler)
↑ QseB (promotes flhDC) |
↑ LEE expression
↑ Motility |
|
| SCFAs < 25 mM | ↑ flhDC | ↑ Motility | |
| Colon | |||
| Ethanolamine | ↑ EutR (promotes eut)
↑ EutR (promotes ler) |
↑ Ethanolamine utilization (fitness and competition)
↑ LEE expression |
|
| SCFAs > 50 mM | ↑ Lrp (promotes ler) | ↑ LEE expression | |
| Low Oxygen | ↑ EspA (T3SS filament) | ↑ Effector secretion | |
| Epinephrine and Norepinephrine | ↑ QseC (promotes recA/SOS response)
↑ QseB (promotes flhDC) |
↑ Shiga toxin
↑ Motility |
|
| Mucin | ↓ flgABFGH and flgJ (flagellar genes) | ↓ Motility | |
Table 1.1. Select signals affecting virulence gene expression in E. coli O157:H7 within the host. Adapted from (Barnett Foster, 2013). SCFAs: small chain fatty acids.
The signaling effects related to low pH are discussed in detail in section 1.6.
During transit through the GI tract, two-component quorum sensing (QS) systems, particularly QseBC, play a decisive role in gene regulation. Quorum sensing is a system by which bacteria respond to signaling molecules produced by themselves and neighboring bacteria, the effect of which is directly dependent on the concentration of bacteria in the immediate environment. E. coli O157:H7 QS sensor kinases recognize the signal, and the response regulator enacts the corresponding response. In the GI tract, the microflora produces auto-inducers (AIs). AIs are small, diffusible molecules produced at a basal level and secreted into the environment. AIs will then diffuse through other bacterial cell membranes into the cytosol, where they continue to build up over time. Concentrations over certain thresholds will indicate sufficient bacterial population in the immediate environment to justify changes in gene regulation. The primary AI signal regarding E. coli O157:H7 adherence and motility is AI-3, which is recognized by QseBC. QseBC consists of the sensor kinase QseC, and the response regulator QseB (Antunes & Ferreira, 2010). QseBC is controlled by the global regulator gene luxS (Antunes & Ferreira, 2010). The luxS is part of a complex system of QS and gene regulation, and is involved in production of AIs, multiple metabolic pathways, and gene regulation (Sperandio, Torres, Jarvis, Nataro, & Kaper, 2003). QseB regulates multiple motility genes by the direct binding of QseB to the promoter region of gene flhDC (Barnett Foster, 2013). Flagella are required for the continued passage of E. coli O157:H7 through the GI tract, and also to infiltrate the mucin layer to access the IEC for adherence (Kim, Yoon, Kim, Park, & Cho, 2012) . Exposure to low pH will cause GadE-mediated repression of the LEE, prevents these genes (required for colonization in the colon) from being expressed too early. After the pH-related signals have faded after transiting out of the stomach, QseBC will upregulate LEE and motility genes. QseC binds the LEE-encoded regulator gene ler, which acts as a promoter for expression of other LEE-encoded genes (House et al., 2009) (Morgan et al., 2015). QseB will promote expression of motility genes by binding the flagellar gene promotor region flhDC (Njoroge & Sperandio, 2012). Once the LEE is activated, the global regulator of virulence A (GrlA) will downregulate the expression of flCA (motility) and flhDC (protein synthesis) (Mellies & Lorenzen, 2014) (Njoroge & Sperandio, 2012). In addition to bacterial AIs, QseBC also responds to the host-produced molecule ethanolamine, as well as the hormones epinephrine and norepinephrine (Barnett Foster, 2013). These additional signals allow for a tighter and finely-tuned regulation of virulence and adherence genes in response to signals indicating location within the GI tract. Ethanolamine (EA) is a byproduct of the breakdown of the cell membrane component phosphatidylethanolamine, and present in the large intestine primarily due to high rates of intestinal cell turnover (Gonyar & Kendall, 2014). At EA concentrations not sufficient to promote growth as a carbon or nitrogen nutrient source, EA effects the expression of multiple virulence genes, including the LEE. EutR, encoded within the eut operon, is responsible for detecting EA and promoting expression of the genes responsible for metabolizing it, along with activation of the LEE operon through direct binding of the LEE promoter ler (Luzader, Clark, Gonyar, & Kendall, 2013). At EA concentrations that are sufficient to support growth, it provides a metabolic advantage to EHEC through the ability to use it as a nitrogen source (Kendall, Gruber, Parker, & Sperandio, 2012). Epinephrine and norepinephrine were also shown to increase the expression of genes involved in motility and colonization, and are the subject of study regarding both human infections and bovine colonization (Bansal et al., 2007). Short chain fatty acids (SCFAs) are known to contribute to flagellar expression regulation. Butyrate has been observed to increase the expression of flagellar genes flhDC, contributing to colonization and adherence in the colon (Mellies & Lorenzen, 2014). This effect is negated in the presence of SCFAs propionate and acetate, but propionate and acetate increase fliC expression through a separate mechanism (Mellies & Lorenzen, 2014).
The series of signals described has a significant impact on adherence related genes; however, the full picture of adherence factors and their regulation during infection is not yet clear. The factors described may play roles during initial adherence of E. coli O157:H7 to IECs, but other undiscovered factors may exist. The regulation of initial adherence factors is likely to be influenced by some proportion of the signals described, and likely shares some mechanisms of activation/repression exhibited by these other virulence factors. Once E. coli O157:H7 has navigated to its desired location of colonization and has the hospitable gene expression profile (motility stopped after getting through the mucin, LEE not yet activated, the as-of-yet-unknown initial adherence factors activated), initial adherence takes place. The process of initial attachment and the factors involved are not yet well characterized but are presumed to be encoded outside of the LEE.
1.5.2. Non-LEE Adhesins
Initial adherence of EHEC bacteria is a known step in pathogenesis- a loose attachment between the bacterium and the epithelial cell is required in order to have time to make an intimate attachment through T3SS effectors (Melton-celsa et al., n.d.). Initial adherence of EHEC strains has not been well described (Croxen & Finlay, 2010), though many putative adhesins have been named. Although none have been definitively defined as being involved in initial attachment, several factors show more promise as potential initial adhesins. E. coli has 16 known fimbrial or fimbrial-like operons, but they are not well defined (Croxen & Finlay, 2010). Out of the 16 loci generally accepted to be present in E. coli O157:H7, fewer than half have been characterized. Currently known or proposed non-LEE adhesins are described below.
Adhesin Involved in Diffuse Adherence (AIDA-1/Antigen 43/Cah) was first identified in an infant diarrheal case of EPEC. The locus is found on a 100-kb plasmid that has also been identified in porcine EHEC isolates, and contains two genes: aah, which encodes an autotransporter and adhesin modifier; and aidA, which encodes the adhesin protein. Of note, the aidA1 locus-containing plasmid also encodes the F18 fimbrial genes. AIDA1, Antigen 43 and Cah (antigen 43 calcium binding homolog) are homologous proteins involved in adherence. These proteins are known to be involved in calcium binding, autoaggregation, and biofilm formation, but no evidence exists to implicate its ability to bind eukaryotic cells (Bardiau, Szalo, & Mainil, 2010).
Curli are thin fimbriae present and expressed in many E. coli strains (such as EPEC isolates) and Salmonella but are not known to be expressed in E. coli O157:H7 under bona fide?? (or true) pathogenic conditions. They have been shown to contribute to adherence to Hep2 cells in limited laboratory conditions. Curli fiber formation can be observed in O157:H7 primarily in low temperatures vs 37°C, curli has a better supported role for biofilm formation and has an unknown role in known extraintestinal pathotypes (Uhlich et al., 2002) (Ogasawara, Yamada, Kori, Yamamoto, & Ishihama, 2010).
E. coli Common Pilus (ECP/MAT) is a fimbria regulated by temperature, oxygen, and growth media, and is associated with biofilm formation and persistent colonization of the bovine intestine (Farfan, Cantero, Vergara, Vidal, & Torres, 2013). ECP is found in both pathogenic and nonpathogenic E. coli, and promotes bacterial interactions within biofilms (Barnett Foster, 2013). Although ecp mutations reduced adherence to Hep2 cells, no similar evidence has been shown in Caco-2 or other intestinal cells (Rendón et al., 2007) (McWilliams & Torres, 2014).
EHEC Factor for Adherence (Efa) is located in the PI O122 in non-O157 STEC strains, and a truncated version of this gene is found in O157 strains (Badea et al., 2003). Efa1 has 97.4% amino acid sequence homology with LifA (lymphocyte Inhibitory Factor A), which codes for lymphostatin. Lymphostatin is a toxin which inhibits lymphocyte proliferation and IL-2 and IL-4 production. A strain mutated to be deficient in Efa1 showed decreased adherence in vitro (Bardiau et al., 2010) (Ju, Shen, Toro, Zhao, & Meng, 2013).
E. coli Immunoglobulin binding protein (EibG) is present only in strains negative for eae and saa, and its role is unknown (Bardiau et al., 2010).
EspA is a protein secreted by the LEE-encoded T3SS and is required for the successful translocation of effectors by T3SS. An EspA-deficient mutant completely lost the ability to adhere to HeLa cells (Ebel et al., 1998).
Flagella is well characterized in motility, but also has been recently implicated in adherence as well. Flagella in E. coli O157:H7 are able to bind bovine intestinal mucus, and H-negative mutant strains showed reduced adherence to bovine intestinal tissue explants, though other studies show H-negative strains are able to colonize young calves (Farfan & Torres, 2012) (Sharma, Bearson, & Bearson, 2010). Flagella have also been shown as able to bind epithelial cells, mucin proteins, and extracellular matrix (ECM) proteins, such as laminin and fibronectin (Farfan & Torres, 2012).
Hemorrhagic Coli Pilus (HCP) is a type IV pilus which has been shown to be involved in many virulence pathways, including adherence, invasion, biofilm formation, laminin and fibronectin binding, and twitching motility (Croxen & Finlay, 2010) (Bardiau et al., 2010). An HCP-deficient mutant demonstrated decreased adherence to human intestinal epithelial cells and bovine renal cells in vitro, and to porcine and bovine intestinal tissue explants (Bardiau et al., 2010). HCP/PpdD:PpdD was identified as a type 4 pilus in E. coli K12, and sequence homology confirmed the existence of a homolog gene (hcp) in E. coli O157:H7 (Moreau, 2013).
IrgA Homologue Adhesin (Iha) is found in STEC, EPEC, and UPEC, and is known to be involved in adherence and siderophore activity (Bardiau et al., 2010).
Long Polar Fimbriae (LPF) is a fimbrial adhesin consisting of two loci for LPF1 and LPF2. Although LPF was first described in Salmonella, 4 different homologues have been described in EHEC strains. Based on the location of the loci, LPF can be categorized and LPF1 and LPF2. The LPF1 operon is located on the pathogenicity island OI141, which is specific to the E. coli O157 serogroup, and contains 6 genes. LPF1 expression in a non-fimbriated strain showed an increase in adherence to HeLa and MDCK cells, and the appearance of peritrichous short fimbriae. E. coli O157:H7 strains mutated to be deficient in LPF1 showed a reduced adherence to epithelial cells in vitro and showed a diffuse adherence pattern instead of microcolony formation. LPF1 mutants also showed a reduced ability to bind to ECM proteins fibronectin, laminin, and collagen IV (Farfan & Torres, 2012). The LPF2 operon is located on the PI OI154 and contains five genes. The role of LPF2 is not well understood. In several studies, a role of LPF2 in adherence is not supported: a non-fimbriated K12 strain was made to express LPF2 and showed decreased adherence to Caco-2 intestinal epithelial cells, and a lpfD2 mutant strain showed increased adherence to HeLa cells. Conversely, several studies support the hypothesis that LPF2 is involved in adherence: a mutation causing a deficiency of the LpfA2 showed decreased initial adherence to Caco-2 cells, while HeLa cells showed no change. Additionally, a separate study using a non-fimbriated strain of E. coli resulted in the observation of thin fibrous structures on the bacterial cell surface (Farfan & Torres, 2012). Several truncated LPF homologues have been observed in non-O157 EHEC strains, which when disrupted also show reduced adherence and reduced microcolony formation (Farfan & Torres, 2012).
Sorbitol Fermenting Protein (SPF) is a fimbrial operon containing six genes. Both spf expression and adherence are increased under anaerobic conditions in vitro, though its role in adherence has not been defined.
ToxB is found on the pO157 plasmid in all E. coli O157 strains and approximately half of O26 strains. It shares some homology with Efa1, and may be involved in adherence by promoting the production of effector proteins EspA, EspB, and Tir (Bardiau et al., 2010).
1.6 Acid Resistance and Gene Regulation
1.6.1 Regulation of the Gad System of Acid Resistance
The glutamate-decarboxylase (Gad) system (also known as AR2) is the most significant AR mechanism in E. coli under the extreme acid stress exemplified by the human stomach, and its mechanism is well defined. Most of the genes encoding components of the Gad system are found in the AFI where slp is found, though one operon containing two genes (gadBC) is located slightly outside of this area, and can be transcribed either together with the rest of the gad genes or separately (Tramonti, De Canio, & De Biase, 2008). The Gad system itself has three components: glutamate decarboxylases, antiporters, and transcription regulation. GadA and GadB are isoforms of the glutamate decarboxylase enzyme, though only the gadA is located within the AFI genetic region. GadC is the glutamate/GABA antiporter, and GadE is the expression regulator. When the pH in the bacterial cell drops, GadC will import glutamate from the environment into the cell, where GadA or GadB will replace the carboxyl group with a proton from the cytosol. The resulting products are GABA and CO2 (Foster, 2004) (Zhao & Houry, 2010). GadC will transport GABA in exchange for glutamate; the net result being a decrease of protons and an increase in internal pH (Foster, 2004).
Regulation of gad Gene Expression
Although function of the Gad system is straightforward, its regulation is quite complicated and highly sensitive to external variables. The Gad system has one primary transcriptional regulator, GadE; which is in turn controlled through its transcription (Foster, 2004) (Castanié-Cornet et al., 2010). The master regulator is GadE, a LuxR family transcriptional activator, which binds to a 20-bp region (the gad box) 63-bp upstream of the gad operon (Castanié-Cornet et al., 2010). The gadE is known to have at least 14 regulatory factors affecting its transcription, and additional factors affecting the GadE transcriptional regulation activity (Foster, 2004).
The gadE has three primary regulators: TrmE, EvgAS, and GadW/X (Foster, 2004; Tramonti et al., 2006). TrmE is an GTPase and functions by promoting translation of gadA and gadB mRNA (Zhao & Houry, 2010). EvgAS is a two-component regulatory system; the response regulator (EvgA) activates the AraC-like regulator YdeO, which in turn activates gadE transcription (Masuda & Church, 2003) (Foster, 2004; Zhao & Houry, 2010).
GadX and GadW (GadX/W) are AraC-like transcription regulators active during stationary phase in both minimal and complex media (Foster, 2004). GadX/W can directly induce transcription of gadE, but can also bind the gad box and repress expression of gadA and gadBC in the same fashion as the GadE regulator (Foster, 2004) (Castanié-Cornet et al., 2010). GadX/W responds to multiple signals from multiple physiological conditions, operating as a promoter for gadE in some environments, and a gadA/gadBC repressor in others (Hommais et al., 2004; Tramonti et al., 2008) (Foster, 2004). GadW can also act independently of GadX by repressing expression of RpoS (required for GadX expression), resulting in GadX repression (Tramonti et al., 2006) (Sayed, Odom, & Foster, 2007). The GadX/W regulatory pathway is itself regulated by other molecules, including cAMP, CRP, and RpoS (Sayed et al., 2007) (Foster, 2004). In acidic intracellular conditions, cAMP concentration drops, which will reduce its repression of rpoS. An increase in RpoS expression will in turn induce GadX expression, which will then (in this case) act as a promoter for gadE, inducing expression of the Gad system (Basak, Geng, & Jiang, 2014) (Foster, 2004).
The gadE gene can also be regulated by proteins whose presence is required for Gad system function- RcsB (of the RcsCDB signal transduction system), and RNaseE (an essential ribonuclease) (Carter, Parker, et al., 2012) (Zhao & Houry, 2010). In addition, it responds to several two-component systems- PhoP (response regulator of PhoPQ two component system) can induce transcription by binding to a sequence upstream of gadE and gadW (Zwir et al., 2005). TorR (response regulator of TorSR) represses gadE transcription. GadY, and RpoS protein expressed during stationary phase, increases translation of GadX through stabilization of the gadX mRNA transcript. The gadE is also responsive to the global regulators, such as the histone-like protein H-NS (Barnett Foster, 2013).
Transcriptional Effects of GadE
A study conducted in 2009 by a group of researchers at the University of Michigan investigated the effects of a deletion of gadE in the Sakai E. coli O157:H7 strain, and found that 182 genes showed differential expression in response (Vanaja et al., 2009). It affected gad and other AFI genes; but it also changed expression of 19 LEE-encoded genes including ler (Vanaja et al., 2009). Deletion of gadE in Sakai resulted in downregulation of the LEE operon (Vanaja et al., 2009), which has also been supported by other studies with similar results. GadE has significant DNA-binding properties and is known to bind promoter regions of multiple genes in E. coli including gltBD rfaQ, hdeAB, and rcsA (Hommais et al., 2004). Interestingly, GadE has also been shown to bind to the promoter region of ompC in E. coli K12 (Norioka, Ramakrishnan, Ikenaka, & Inouye, 1986). The effects of GadE on virulence gene expression is an increasingly relevant (prominent??) area of study in EHEC.
1.6.2. The Acid Fitness Island Regulation and Expression
The acid fitness island (AFI) of E. coli is a genomic island found only in E. coli and Shigella, and was first reported to be involved in acid tolerance in 2004 (Castanié-Cornet et al., 2010) (Mates, Sayed, & Foster, 2007). In E. coli K12, the AFI is ~14 kb and contains 12 protein-encoding genes (Hommais et al., 2004) (Tramonti et al., 2008). In E. coli O157:H7, the AFI is ~23 kb and contains 21 protein encoding genes due to the insertion of an O-island. Between the genes yhiF and yhiD, E. coli O157:H7 has the sequence for O-island 140 (OI140), which contains nine genes (chu genes) involved in heme uptake and utilization, termed the heme transport locus [silenced]. The genes present in each AFI are outlined in Table 1.2 below.
Table 1.2. Acid Fitness Island Genes
| K12 (~13 kb) | 3651984 | 3665603 | |||||||||||
| Genes | slp | yhiF | — | hdeA | hdeB | yhiD | hdeD | gadE | mdtE | mdtF | gadX | gadW | gadA |
| O157:H7 (~23 kb) | 4454268 | 4476943 | |||||||||||
| Genes | slp | yhiF | *** | hdeA | hdeB | yhiD | hdeD | yhiE (gadE) | yhiU (mdtE) | yhiV (mdtF) | yhiX (gadX | yhiW (gadW) | yhiX (gadX) |
| ↓ | |||||||||||||
| ***
Not present in K12 |
chuS | chuA | Z4912* | chuT | chuW | chuX | chuY | chuU | Z4919* | ||||
Table 1.2. List of genes encoded in the AFI region in E. coli K12 and E. coli O157:H7.
Most studies on the regulation of AFI-encoded genes and their effects have been done in E. coli K12, and the fewer studies involving E. coli O157:H7 strains have highlighted major differences in behavior. As described in section 1.6.1, GadE is the major regulator (sometimes called the master regulator) of most AR-related genes, and the K12 AFI is mainly expressed under the conditions of entry into stationary phase growth, and low pH. The E. coli O157 AFI also responds to these conditions, but also has a tightly connected relationship with the regulation of the LEE. In 2000, a group at the Howard Hughes Medical Center generated and studied an hdeA deletion mutant strain of E. coli K12 (MG1655), a putative periplasmic chaperone protein encoded in the AFI. The E. coli K12 ΔhdeA strain was grown to stationary phase in standard Luria Bertani (LB) broth, exposed to acid stress at pH 2.5, then diluted in fresh pH 7 LB broth and measured for viability by optical density. Although the E. coli K12 ΔhdeA strain in this study did not survive (Gajiwala & Burley, 2000), a report from 2007 observed little AR effect from a similar ΔhdeA mutation (Mates et al., 2007). Later, another study over-expressed two regulators??? in E. coli K12 (MG1655) to observe the effects on acid resistance and AR-related gene expression. Overexpression of EvgA and YdeO in log phase cultures exposed to acid stress at pH 2.5 led to upregulation of four genes (yhiF, hdeA, hdeD, and gadE) but control cultures failed to implement acid tolerance and did not survive acid stress at pH 2.5. Additionally, mutations of these four genes did not show any significant impact on AR (Masuda & Church, 2003).
The slp Gene
The slp gene has been noted as a potential gene of interest from several studies investigating virulence gene expression. Although slp and its small operon slp–yhiF have some investigations of their function, there is no conclusion about its function beyond an assumed (and generally accepted) role in membrane stabilization when upregulated.
In 2007, a study proposed a new hypothesis on the functions of Slp and YhiF. They provide evidence that Slp and YhiF function to protect E. coli from its own toxic metabolic products during organic acid metabolism. Single deletion mutations of slp or yhiF did not have any significant impact on viability in the presence of several toxic metabolites tested, but a double mutation of slp and yhiF significantly dropped viability in media containing 20 mM formate, 40 mM lactate, or 40 mM succinate (Mates et al., 2007). These results suggest that Slp and YhiF may have redundant functions in the protection of the E. coli bacteria from toxic organic acid metabolites, though whether these mechanisms are related or independent remains to be seen. YhiF is a putative LuxR family regulator, but the exact function of Slp in this capacity is unknown. The authors put forward the possibilities of roles regarding signal transduction to activate an organic acid protection mechanism, or to limit the transport of these types of organic acids across the membrane; however, there is no current data to indicate the exact function of Slp (Mates et al., 2007).
One interesting study from the University of Denmark in 2003 showed a significant increase in slp expression during the initial stages of biofilm formation, also using E. coli K12 (MG1655) (Schembri, Kjaergaard, & Klemm, 2003). Observed biofilms were established a flow chamber system using minimal media supplemented with glucose, designed such that all planktonic cells were washed away before any observations took place. When compared to expression profiles between log-phase and stationary-phase cultures, many genes showed significant expression differences (≥2.5-fold change). However, slp expression was 6.28-fold higher in the biofilm cultures only when compared to log-phase cultures, but not significantly different from stationary phase cultures (1.35-fold). The slp expression found to be very low in log phase growth. However, these data were acquired from nonpathogenic E. coli K12, so the relevance of these results in relation to biofilm formation or pathogenesis remain to be seen (Schembri et al., 2003).
A 2012 study at the University of Minnesota of global gene expression using microarrays compared E. coli K12 (MG1655) with E. coli O157:H7 (EDL933/ATCC 43895) during attachment to lettuce leaf surfaces over three days. Of the 3,798 genes shared by both strains, contact with the lettuce leaves resulted in differential expression in 10.1% of K12 genes and 8.7% of the O157:H7 genes. Only 3.1% were significantly changed in both strains. Curiously, the slp gene was significantly downregulated (-11.9-fold) in only K12, while not significantly changed in O157:H7 (Fink et al., 2012). However, the K12 expression was in comparison to stationary phase cultures, while the O157:H7 expression was compared to time 0 cultures (i.e. gene expression at the time of inoculation). O157:H7 genes were defined at significantly differentially expressed if fold change was ≥2 on days 1 and/or 3 (when normalized using the housekeeping gene gyrB). The difference between slp expression in these conditions in nonpathogenic K12 and pathogenic O157:H7 has interesting implications in regard to a possible role for Slp during pathogenesis.
A 2008 study from the University of Maine examined the antimicrobial effects of cranberry concentrate in ground beef, as they had previous reported bacterial membrane damage by cranberry concentrate using transmission electron microscopy??. Using a quantitative real-time PCR to measure the effects of cranberry concentrate on several outer membrane proteins??? (ompC and slp), and other membrane or membrane synthesis proteins (osmY, cfa, and hdeA). The slp was modestly downregulated in conditions that showed anti-microbial activity, though the specificity and implications of these results are unclear (Wu, Qiu, de los Reyes, Lin, & Pan, 2009).
1.7. The Polymeric Immunoglobulin Receptor (pIgR)
1.7.1. The pIgR and Intestinal Immunity
The eukaryotic protein, polymeric immunoglobulin receptor (pIgR), is present in most vertebrates, and is expressed on mucosal epithelial cells (Kaetzel, 2014). Expression has been observed at all mucosal surfaces and at low levels in human hepatocytes but is most highly expressed in IECs. The human pIgR is a glycoprotein varying in size from 80-120 kDa depending on the level of glycosylation (Mostov & Blobel, 1982). The protein contains extracellular, transmembrane, and intracellular domains. The intracellular portion contains signaling and transport sequences responsible for intracellular sorting, transcytosis, and endocytosis; while the extracellular domains retain the functional binding component of the protein (Asano & Komiyama, 2011). The extracellular fraction is composed of six domains organized in a chain-like manner. The domain 6, located closest to the IEC membrane, is the linker between the extracellular portion of the pIgR and the transmembrane domain (Kaetzel, 2005). The domain 6 is also where proteolytic cleavage takes place during normal immune function, and is the least conserved sequence between species (Mostov & Blobel, 1982). The remaining domains 1-5 are organized such that domain 1 is the furthest from the IEC membrane. Domains 1-5 contain the active functional site which binds to dimeric Immunoglobulin A (dIgA), and this sequence is highly conserved among species (Mostov & Blobel, 1982). IECs form a single cell layer above the basal lamina, which separates the basolateral side of the epithelial layer (containing the lamina propria) from the lumen of the intestine. The lamina propria secretes most of the dIgA present in the intestinal environment, and the pIgR is used to transport it through the epithelial cell layer into the intestinal lumen. The dIgA is a crucial part of mucosal immunity, playing an important role in maintaining the balance between immune function and microflora homeostasis. The pIgR is expressed on the basolateral surface of the IEC, where it binds to dIgA. The pIgR-dIgA complex is then transported through the IEC by transcytosis and expressed on the cell surface on the apical (luminal) side, where the complex is then proteolytically cleaved and released into the lumen environment. The cleavage occurs at domain 6, and is done by an unknown protease or proteases (Rojas & Apodaca, 2002).
The pIgR-dIgA complex, once cleaved from the IEC surface, is called secretory IgA (sIgA). In addition, unbound pIgR is also cleaved and released, and is called free secretory component (SC) (Asano & Komiyama, 2011). Both molecules serve individual immune functions in the environment, and the SC portion of sIgA protects it from proteolytic degradation (Kaetzel, 2005). The sIgA and SC both function very effectively to recognize and inactivate potentially harmful antigens and pathogens, but sIgA is crucial to intestinal homeostasis because it specifically targets antigens and microorganisms that are not part of the normal, healthy microbiota (Johansen & Kaetzel, 2011). Imbalance of immune function is a known cause and risk factor for many autoimmune and digestive disorders such as inflammatory bowel disease (IBD), but pIgR has also been observed to play an active role in the colonization and virulence of several disease-causing pathogens in humans- its role as an adhesin receptor for Streptococcus pneumoniae has been well documented.
1.7.2. The pIgR in Pathogenesis
Streptococcus pneumoniae is a Gram-positive, encapsulated pathogen which colonizes the human nasopharynx, leading to lower respiratory, lung infections, and middle ear infections. S. pneumoniae has evolved to use the human pIgR for adherence and internalization by epithelial cells during infection, using its adhesin PspC (pneumococcal surface protein C) (Agarwal, Asmat, Dierdorf, Hauck, & Hammerschmidt, 2010). PspC (also known as CbpA or SpsA, but distinct from PspA) is a multifunctional protein that is also involved in choline binding. PspC has been shown to bind specifically to only human SC and the SC portion of sIgA (Elm et al., 2004). A specific, highly conserved hexapeptide motif has been identified as the critical pIgR binding domain, required for pIgR adherence and internalization (Elm et al., 2004). A pharmacological inhibition study designed to outline the cell-signaling pathway responsible for internalization has shown that S. pneumoniae utilizes the same pathways as other pathogens of diverse natures such as Staphylococcus aureus, Neisseria meningitidis, and Listeria monocytogenes, suggesting the possibility that this adherence mechanism might be utilized by other bacterial pathogens as well (Agarwal et al., 2010).
1.7.3. Influence of E. coli O157:H7 on the pIgR System
Known Effects of EHEC on the pIgR
There are several known mechanisms by which pathogenic E. coli effect the expression and function of the pigr gene and pIgR protein. If the observed colocalization in the present study?? was due to a factor other than adherence, then it could be a result of mucosal immunity/inflammatory pathways being activated in the IEC. Like many enteric bacteria, E. coli is a Gram-negative organism, and contains LPS in its membrane. The LPS molecule is a potent activator (and only known ligand) of Toll-like receptor 4 (TLR4), which causes an increased expression of the transcription factor NF-κB when activated (Schneeman et al., 2005). NF-κB is a highly effective activator of multiple proinflammatory signals, and among other effects it can induce transcription of the pigr. If the presence of LPS was responsible for the significant increase in pigr expression (and subsequent increase in translation of pIgR), then the presence of increased pIgR on the IEC surface could be an immune response to the bacteria. There are several counterpoints to this theory. Mainly, the consistent and highly correlated occurrence of only the virulent bacteria with the protein together during colocalization. If LPS was playing a role, there would be a much higher proportion of colocalization observed with the nonpathogenic K12 strain. Although nonpathogenic, E. coli K12 is still capable of releasing endotoxin. The low levels of colocalization seen with K12 were more consistent with coincidental overlay of pixels due to chance instead of any type of correlated relationship. And as seen with E. coli O157:H7, the co-variance of pIgR with E. coli K12 does not increase over time as one might expect to see in a non-specific immune response to bacterial adherence.
E. coli O157:H7 has the capacity to recruit its own adhesin receptors through effector proteins. The adhesin intimin is able to bind the eukaryotic protein nucleolin in addition to its own receptor (Tir) and is also capable of manipulating the host cell into increasing expression of nucleolin on its surface. Although the main function of nucleolin is with ribosome synthesis, it can also be found on the IEC surface. A 2006 study found that Stx2 promotes recruitment of nucleolin to the IEC surface, where it binds intimin. This interaction significantly increased the ability of O157:H7 to adhere to Hep-2 cells in vitro (Robinson et al., 2006). Although this particular mechanism has a significant impact on adherence and colonization only after intimate adherence and the engagement of the T3SS, the existence of such a mechanism implies the possibility that this type of approach may also be used in other circumstances, such as initial adherence. This kind of system would require a host cell response to be immediate or easily upregulated. The mechanism by which E. coli O157:H7 recruits nucleolin is unknown but is speculated to be part of a global stress response, which can produce rapid changes in host cells.
Stx is not secreted through the T3SS pathway, and are not subject to its regulation, limitations, or time scale. Shiga toxins are primarily released after accumulating in the cytosol of a bacterial cell, which lyses and releases Stx into its immediate environment. Shiga toxins cause ribotoxic stress responses in the host cell, which activates many factors involved in innate immunity and inflammation (Karpman & Ståhl, 2014). Stx is a major effector in the virulence of EHEC infection, and the secretion of Stx is associated with increased virulence. Stx induces damage by internalization through its receptor Gb3 and subsequent inactivation of protein translation machinery resulting in cell death (see Chapter 1 for details of Stx and its role in disease pathogenesis). Stx has also been observed to cause disordering in host cell membranes in some circumstances, which could also lead to a variety of stress responses that could result in increased immune pathway signaling/activation (Johannes & Römer, 2010). Although the colonization advantage provided by Stx2 is through the recruitment of nucleolin (as described above), there are several other mechanisms by which it affects the host and the possibility of a role in initial adherence cannot be discounted. Current literature focuses on the effects of Stx during or after intimate adherence, so its potential role in initial adherence is unclear, but the short window of interaction between Stx secretion in close proximity to the IEC and engagement of intimate adherence makes this an unlikely explanation for the colocalization observed. Additionally, a mounting immune/inflammatory response it does not fit the pattern of an early increase of pIgR colocalization followed by a steady decline as this would more likely result in a steady increase over time. Stx is capable of potently inducing the expression of the proinflammatory cytokine IL-8 through the ribotoxic stress response in multiple cell types in vitro, including Caco-2 cells; this is observed after intimate adherence takes place and does not explain the pigr gene expression or colocalization observed. E. coli O157:H7 has been shown to decrease the expression of NF-κB during adherence to HeLa cells, but this is due specifically to an effector protein EspB, which is secreted using the T3SS encoded in the LEE operon, and is not exposed to the host cell until after intimate adherence takes place (Hauf & Chakraborty, 2003).
The effectors described as having known effects on pigr gene expression and pIgR translocation are specifically due to factors that are only utilized after they are secreted into the host cell through the T3SS. The T3SS, as a LEE-encoded virulence factor, is not active during the initial adherence time frame, which is loosely defined as taking place between 0 and 3 hours. Many studies have described LEE-encoded gene expression over time and cited activation beginning no earlier than 3 to 4 hours and is consistent with the eae gene expression shown for E. coli O157:H7 used in this study. This timeline does not allow enough time for EHEC to engage its T3SS apparatus, which precludes the presence of the potentially relevant virulent effector proteins inside the IEC.
pIgR Protein Behavior
In addition to the restrictions of the initial adherence timeline, there is no evidence to suggest that pIgR has any mechanism of membrane location specificity, and it has no regions that resemble known intracellular signaling sequences or motifs. Extensive review of the pIgR transcytosis pathway makes it extremely unlikely that there are any unknown signaling events (Johansen & Kaetzel, 2011; Kaetzel, 2001, 2005; Phalipon & Corthésy, 2003; Piskurich et al., 1997; Schneeman et al., 2005; Sunagawa et al., 2013), and there is thorough evidence that pIgR (unbound or bound to dIgA) gets sorted through a general membrane localization pathway. The transcytosis of pIgR to the apical (lumen) surface begins endocytosis in clathrin-coated pits followed by the inactivation of its basolateral membrane location signal in the C-terminus (Cardone et al., 1996). Following this step, pIgR is moved by microtubule-dependent apical recycling endosomes to the apical cell membrane. Without the presence of dIgA, pIgR is expressed at a low basal level. The event of dIgA-pIgR binding does result in activation of the p62 YES tyrosine kinase, causing a signaling cascade in the Cγ1 pathway that increases the rate of exocytosis to the apical surface (Cardone et al., 1996). However, this only increases the rate at which pIgR reaches the membrane, it does not have any effect on the further location of pIgR to any particular area regardless of where a bacterium might be attached to the surface. Along the same line, inflammatory signals are capable of increasing pigr transcription and translation, but this does not affect membrane location any more than the rate of transcytosis (Cardone et al., 1996). Thus, even if immune or inflammatory responses to EHEC attachment may increase the overall amount of pIgR on the IEC cell surface in a timeline consistent with initial adherence, it would likely only be responsible for a coincidental, slight increase colocalization by increased likelihood of proximity, but still would not account for the high correlation observed between E. coli O157:H7 and pIgR during colocalization. That phenomenon can only be fully explained by incorporating the pathogen location behavior into the equation, as there is no obviously viable way for the host to be fully responsible for the colocalization patterns presented.
1.8. Bovine Hosts and EHEC
1.8.1. Reservoir and Asymptomatic Carriage
E. coli O157:H7 and other EHEC are found in the GI tract of cattle and other ruminants, with cattle being the primary natural reservoir (Berry & Wells, 2010) (Chase-Topping, Gally, Low, Matthews, & Woolhouse, 2008) (Brichta-Harhay et al., 2008). Other small ruminants, such as sheep and goats, and several non-ruminants, such as birds and rabbits, have also been shown to carry E. coli O157:H7 but are not known to be significant sources of outbreaks (Berry & Wells, 2010). Adult cattle are asymptomatic carriers, while pre- and post-weaning calves are susceptible to pathologies during E. coli O157:H7 colonization. E. coli O157:H7 is able to colonize the bovine intestinal tract without causing disease in adult cattle, leading to contamination of food products through hide contamination during slaughter as well as the environment due to fecal shedding (Berry & Wells, 2010).
Cattle can become colonized with E. coli O157:H7 and other EHEC strains through their environment in a wide variety of ways, such as other cattle, wild animals or insects, contaminated drinking water or food, and others. Once ingested, the bacteria travel through the GI tract until reaching the large intestine. It has been shown that E. coli O157:H7 will colonize specifically at a small site at the distal end of the large intestine called the recto-anal junction (RAJ) (Kudva & Dean-Nystrom, 2011). The RAJ is located at the junction between the descending colon and the anal canal, identified by a change from columnar epithelial cells present in the colon to non-keratinized stratified squamous epithelial cells (Kudva & Dean-Nystrom, 2011). Within ~5 cm of this junction, a dense collection of lymphoid follicles is found, called lymphoid follicle dense mucosa (Naylor et al., 2003). About 3-5 cm proximal to the RAJ, an area of highly concentrated lymphoid follicles covered by a single cell layer of epithelial cells is the follicle-associated epithelium (FAE) (Kudva & Dean-Nystrom, 2011). The exact role of lymphoid follicles in bovine colonization is unknown, though other enteric pathogens, such as Salmonella and Listeria show tissue tropism for similar sites (Peyer’s patches) in human hosts. There is also evidence that the intimin subtype intimin γ (a critical adhesion protein subtype) may bind Peyer’s patches in human hosts with a higher degree of specificity than other intimin subtypes, indicating a possible role in virulence (Naylor et al., 2003). In order to determine the role of the RAJ in bovine colonization, in 2011 Kudva et. al developed an in vitro adherence assay using cells collected by swab from the RAJ region of live cattle, allowing isolation of recto-anal junction squamous epithelial cells (RSE cells) (Kudva & Dean-Nystrom, 2011). In this study, it was shown that E. coli O157:H7 bound more effectively to RSE cells than did non-pathogenic strains, with both higher numbers of total RSE cells bound, and higher numbers of bacteria bound to each cell. Although different breeds of cattle did show some differences in susceptibility and shedding, most results were consistent over multiple variables, such as cattle age, sex, and geographic location, which supports the idea that host factors do not play a large role in colonization (Jeon, Elzo, DiLorenzo, Lamb, & Jeong, 2013). Evidence suggests that the tissue tropism observed in the RAJ is related to the presence of RSE cells and FAE, though the exact roles of each region have yet to be defined (Kudva & Dean-Nystrom, 2011).
1.8.2. Transmission
The true prevalence of E. coli O157:H7 and other EHEC strains in cattle is not fully known, and estimates range from 0 to 30% of cattle in the United States, while around the world they can vary as much as 0 to 57% (Matthews et al., 2005) (Rhoades, Duffy, & Koutsoumanis, 2009). Estimates of prevalence can vary by season and sampling method (fecal counts, rectal swabs, and environmental sampling), leading to some conflicting reports (Berry & Wells, 2010) (Rhoades et al., 2009). E. coli O157:H7 and other EHEC are shed in the feces and have very high rates of variability. Risk factors associated with higher rates or duration of shedding include (but are not limited to) age, seasons, temperature, and diet. E. coli O157:H7 prevalence is lowest in calves younger than 6 months old, intermediate in adult cattle, and highest in the post-weaning age (after 6 months) (Gyles, 2007). Seasons are also known to play a role, with significantly higher shedding in warmer months and lower shedding in cooler months (Gyles, 2007). Risk factors for high degrees of shedding are related to diet, thought to affect E. coli acid stress tolerance (Callaway & Carr, 2009). The addition of probiotics to feed in the form of live bacteria have shown some promise of reducing E. coli O157:H7 populations in vitro and in experimentally infected calves and cattle. In adult cattle, Lactobacillus acidophilus and Propionibacterium freudenreichii in feed reduced E. coli O157:H7 prevalence from 27 to 16% in the feces, and from 14 to 4% on the hide (Callaway & Carr, 2009).
Transmission of EHEC to humans occurs through the fecal-oral route of transmission and can be transmitted to hosts in four main ways: direct contact, environmental, person-to-person, and foodborne. Routes of transmission vary between case types (sporadic cases vs. outbreaks vs. multi-state outbreaks), with food borne infections ranging from 52% to 100% (Rangel et al., 2005). Cases were traced back to multiple sources, typically beef, raw produce, unsanitary water, unpasteurized dairy products, and unpasteurized juices (Hunt, 2010). Between 1994 and 2005, there were 24 multi-state outbreaks in the United States. Multi-state outbreaks occur on an average of 1-3 per year with a range of 1-6, and 100% of multi-state outbreaks were food borne. Contamination occurred 67% by ground beef, 25% by produce, and 8% unknown. Person to person transmission is more commonly seen in sporadic and outbreak cases, most frequently in child daycare centers (Rangel et al., 2005). In the United States, over 500 EHEC serotypes have been isolated from infected patients. Within these 500, less than ten serogroups are responsible for over 75% of confirmed cases (Gyles, 2007). Within this group, six non-O157 O groups have been declared as meat adulterants by the USDA and are associated with 75-80% of cases: O26, O45, O103, O111, O121, and O145 (Hegde et al., 2012). Complete characterization of the pathogenesis and virulence of non-O157 EHEC strains is not yet available; however, significant evidence exists that these strains can cause disease as severe as E. coli O157:H7 (Hunt, 2010). According to the Argentine Database of the National Reference Laboratory (NRL), in the time period of 2004 to 2009, six non-O157 serogroups were responsible for 30% of all STEC infections in Argentina (Tanaro et al., 2012). More importantly, Argentina has the highest rate of HUS complications in the world, and 40% of those cases are caused by non-O157 EHEC strains (Tanaro et al., 2012). In 2011, the CDC reported an estimated 113,000 cases of non-O157 EHEC infections, while during the same time period, E. coli O157:H7 infections estimated 63,000 cases (Tanaro et al., 2012).
1.8.3. Interventions in Transmission or Prevalence
Intervention strategies can be applied at any point in the transmission cycle, but most have focused at the levels of colonization and environmental/hide contamination (Callaway & Carr, 2009). Pre-harvest interventions include diet, probiotics, and vaccines. Much attention has been given to diet, and its possible potential to reduce shedding in cattle. Several studies have demonstrated the possibility that hay diets, good quality forages, and elimination of fasting periods could reduce EHEC shedding, but evidence is inconsistent and significance is small (Callaway & Carr, 2009). Additionally, significant diet changes are not economically viable for most farms. Probiotics such as L. acidophilus have shown to decrease E. coli O157:H7 shedding in some studies, but not in others (Callaway & Carr, 2009). The direct application of antimicrobials, in the form of lytic bacteriophages, to the terminal rectum has likewise shown little promise (Naylor et al., 2007). Post-harvest sanitation of the cattle carcass had reduced EHEC prevalence, but not eliminated it (Callaway & Carr, 2009). Currently, most interventions take place at the post-harvest state during processing of carcasses in a meat processing plant. Several studies have investigated the use of vaccines based on secreted proteins, which can show some success in vitro, but none have shown significant success in the field (Naylor et al., 2007).
Chapter 2: Materials and Methods
Note: additional information regarding materials and methods used can be found in Appendix A and are noted with a † symbol.
Table 2.1. Bacterial Strains and Plasmids
Growth conditions for bacterial strains, unless otherwise indicated, were at 37°C in Luria Bertani (LB) broth or on LB agar plates, with the addition of antibiotics as noted in Table 2.1.†
Table 2.1. Bacterial Strains and Plasmids
| Strains or Plasmids | Description | Genotype |
| Strains | ||
| MG1655 | E. coli K12 nonpathogenic laboratory strain | O Serogroup: N/A
Pathotype: N/A Shiga toxin 1 (stx1): – Shiga toxin 2 (stx2): – Intimin (eae): – |
| EDL 932
(ATCC #43894) |
E. coli O157:H7 wild-type | O Serogroup: O157
Pathotype: EHEC Shiga toxin 1 (stx1): + Shiga toxin 2 (stx2): + Intimin (eae): + |
| ΔchuA | E. coli O157:H7 ΔchuA
|
O Serogroup: O157
Pathotype: EHEC Shiga toxin 1 (stx1): + Shiga toxin 2 (stx2): + Intimin (eae): + chuA: – |
| ΔfhuE | E. coli O157:H7 ΔfhuE
|
O Serogroup: O157
Pathotype: EHEC Shiga toxin 1 (stx1): + Shiga toxin 2 (stx2): + Intimin (eae): + fhuE: – |
| ΔompC | E. coli O157:H7 ΔompC
|
O Serogroup: O157
Pathotype: EHEC Shiga toxin 1 (stx1): – Shiga toxin 2 (stx2): – Intimin (eae): – ompC: – |
| Δslp | E. coli O157:H7 Δslp
|
O Serogroup: O157
Pathotype: EHEC Shiga toxin 1 (stx1): – Shiga toxin 2 (stx2): – Intimin (eae): – slp: – |
| Δslp(pKD3::slp) | E. coli O157:H7 Δslp::(pKD3::slp)
|
O Serogroup: O157
Pathotype: EHEC Shiga toxin 1 (stx1): – Shiga toxin 2 (stx2): – Intimin (eae): – pKD3:slp: + |
| O26.6 | E. coli O26 uncharacterized field isolate* | O Serogroup: O26
Pathotype: EHEC Shiga toxin 1 (stx1): + Shiga toxin 2 (stx2): + Intimin (eae): + |
| O103.5 | E. coli O103 uncharacterized field isolate* | O Serogroup: O103
Pathotype: STEC Shiga toxin 1 (stx1): + Shiga toxin 2 (stx2): + Intimin (eae): – |
| O145.10 | E. coli O145 uncharacterized field isolate* | O Serogroup: O145
Pathotype: EPEC Shiga toxin 1 (stx1): – Shiga toxin 2 (stx2): – Intimin (eae): + |
| Plasmids | ||
| pKD119 | λ Red recombinase expression plasmid | Antibiotic resistance: Tetracycline (TetR)
Growth: 30°C |
| pKD3 | λ Red recombinase plasmid containing FRT-flanked chloramphenicol resistance cassette | Antibiotic resistance: Chloramphenicol (CmR) |
| pCP20 | λ Red recombinase FLP expression plasmid | Antibiotic resistance: Ampicillin (AmpR)
Growth: 30°C |
| pUC18 | Complementation cloning plasmid | Antibiotic resistance: Ampicillin (AmpR) |
*Isolates were kindly provided by Dr. Chobi DebRoy at the E. coli Reference Center at The Pennsylvania State University, University Park, PA
2.2. Cell Culture and Media
All cell cultures were grown at 37°C with 5% CO2, in Eagle’s Minimum Essential Medium (EMEM) (American Type Culture Collection (ATCC) 30-2003, Manassas, VA) plus 10 or 20% Fetal Bovine Serum (FBS) (S12495) (Atlanta Biologicals, Flowery Branch, GA) unless otherwise indicated.
Immortalized cell lines:
Caco-2 (ATCC HTB-37), a human colonic epithelial cell line isolated from a case of colorectal adenocarcinoma (grown with 20% FBS).
CCD 841 (ATCC CRL-1790), a human colonic epithelial cell line.
IAXsSBR (ATCC CRL-1677), a rat small intestinal epithelial cell line isolated from a case of adenocarcinoma, grown in F12K (ATCC 30-2004) plus 10% FBS.
Madin-Darby bovine kidney (MDBK) epithelial cell line (ATCC CCL-22)
Primary cells:
RSE cells: from frozen stocks, vials were thawed and warmed to 37°C and incubated in pre-warmed DMEM + 10% FBS for at least two hours before use (as per instructions)†.
RSE cells were provided by Dr. Indira Kudva at the USDA, Agricultural Research Service (ARS), National Animal Disease Center (NADC), Food Safety and Enteric Pathogens Research Unit in Ames, IA. RSE cells were collected as described by Kudva et. al. (Kudva & Dean-Nystrom, 2011).
2.3. Infection
The following protocol was followed for all experiments involving infection of cell cultures (immortalized cell lines or primary cells as listed in Section 2.2.) with bacterial strains (listed in Table 2.1.) including microscopy, quantitative adherence, and RNA sequencing. Cell types and bacterial strains used in individual experiments are noted in corresponding figures.
Eukaryotic cells of choice were grown to confluency in tissue culture-treated six well plates (company??), and two to four hours prior to infection, rinsed once with sterile phosphate-buffered saline (PBS) and fresh media applied. Bacterial strain(s) of choice were inoculated at an appropriate multiplicity of infection (MOI) per protocol, allowed to equilibrate to 37°C for five minutes, and incubated for times indicated†. After incubation, cell culture medium was removed, and cells were washed gently (by tilting and swirling) with sterile PBS three times to remove unadhered bacteria.
2.4. Microscopy
Infection for microscopy was done as described in Section 2.3, with a MOI of approximately 20†. All eukaryotic cells were grown as described, except for the placement of sterile glass cover slips (company???) in the six well plates as a growth surface before seeding. After infection, samples were fixed using formalin for ten minutes at room temperature and rinsed with PBS three times. Fluorescent stains were applied as listed below, with two PBS rinses in between each stain; slides were stored in glycerol-based mounting media and away from light†.
1° pIgR (unconjugated) antibody: PIGR rabbit IgG polyclonal antibody (Thermo Fisher Scientific Waltham, MA #PA5-22096), stained at 1:750 dilution in PBS for 60 minutes.
2° pIgR (fluorophore-conjugated) antibody: goat anti-Rabbit IgG (H+L) Secondary Antibody (DyLight 488 Thermo Fisher Scientific #35552), stained at 1:1,000 dilution in PBS for 60 minutes.
1° E. coli (unconjugated) antibody: E. coli goat IgG polyclonal antibody (Thermo Fisher Scientific PA1-73032), stained in 1:1,000 dilution for 60 minutes.
2° E. coli (fluorophore-conjugated) antibody: donkey anti-goat IgG (H+L) Secondary Antibody (DyLight 594 Thermo Fisher Scientific #SA5-10088), stained at 1:1,000 dilution in PBS for 60 minutes.
Nuclear fluorescent stain: Hoechst 33342 (Thermo Fisher Scientific #62249), stained at 1:1,000 dilution in PBS for 5 minutes.
2.5. Adherence
Infection of eukaryotic cells was done as described in Section 2.3. After infection and incubation, samples were collected dispensing 100 µL sterile 10% triton X-100 (Sigma-Aldrich X100-100ML, St. Louis, MO) in PBS and incubated at room temperature for 10 minutes until cells detached from the well plate. A 900 µL-volume of sterile PBS was added to rinse the well and samples were collected by a sterile cell scraper for a total sample volume of 1 mL. Samples were resuspended in (volume of PBS?) and vortexed vigorously until no visible cell clumps remained, ten-fold serial dilutions were made by adding 100 µL of sample into 900 µL sterile PBS in succession. A 100 µL volume of each dilution was plated and grown on LB plates overnight at 37°C before counting. All adherence assays were normalized by calculating colony-forming units (CFU) per inoculum to ensure accuracy and performed in triplicate†. To calculate adherence, bacterial counts were adjusted by dilution factor, averaged, and the percent adherence was calculated from the number of adhered bacteria per the number of inoculated bacteria per well. The percent adherence per well was then compared to the maximum adherence count (wild-type count at 3 hours post- infection) to calculate relative adherence per sample†.
2.6. RNA Preparation
After infection as described in Section 2.3, samples were collected by a sterile cell scraper and wells were rinsed with 1 mL sterile PBS to ensure collection of all components. Samples were kept on ice at all times and processed immediately to avoid degradation.
Bacterial mRNA: samples were processed with the Ambion Ribopure Kit (AM1924, Thermo Fisher Scientific) for recovery of total RNA; then processed with the Ambion MicrobEnrich Kit (AM1901, Thermo Fisher Scientific) to purify prokaryotic RNA by positive-selection removal of eukaryotic RNA; then processed with the Ambion MicrobExpress Kit (AM1905, Thermo Fisher Scientific) to purify prokaryotic mRNA by positive-selection removal of prokaryotic rRNA to obtain pure bacterial mRNA.
Eukaryotic mRNA: samples were processed using the GenElute Direct mRNA Miniprep kit (DMN10, Sigma-Aldrich) using positive selection of eukaryotic mRNA transcripts.
Quality and concentrations of RNA samples were done by measuring AD 260/280 ratios using a NanoVue Plus spectrophotometer (GE Healthcare Life Sciences, Pittsburg, PA). A 260/280 ratio of ~2.0 was considered pure.
2.7. Quantitative real-time PCR (qPCR)
The purified mRNA samples collected as described in 2.6 were reverse-transcribed to cDNA using the iScript cDNA Synthesis kit (#170-8890, BioRad, Hercules, CA). The cDNA samples were then concentrated and cleaned of reverse transcription reaction components using ethanol precipitation: to each sample, 10% (of total reverse transcription reaction volume) volume of 3 M sodium acetate pH 5.2 was added; 2.5 volumes of 100% ethanol was added; sample was vortexed thoroughly and incubated at -20°C for a minimum of six hours to form a DNA precipitate. After precipitation, samples were centrifuged (in a standard microcentrifuge) at ˃10,000xg for 30 minutes at 4°C; pellets were rinsed once with ice-cold 70% ethanol; pellets were then air dried and resuspended in water and assessed for purity and concentration using AD 260/280 ratios.
Using cDNA as PCR template: 20 µL qPCR reactions were made using 50-500 ng of template cDNA, 10 µL Applied Biosystems SYBR Green PCR Master Mix (#4309155, Thermo Fisher Scientific,), and molecular-grade water up to 20 uL total volume.
The qPCR was done using the 7500/7500 Fast Real-Time PCR System (Applied Biosystems/Thermo Fisher Scientific) using the default PCR cycling settings (hold stage: 10 minutes at 95°C; cycling stage (40 cycles): 15 seconds at 95°C + 1 minute at 60°C).
Relative expression was calculated using the relative expression ratio where efficiency (E) was calculated using the slope of a standard curve of ten-fold serial dilutions of DNA template: E =10^(–1/slope), and the fold change was calculated as:
FC = [(Etarget)^(ΔCttarget (control – sample))] / [(Eref)^(ΔCtref (control – sample))]
when E= efficiency of target or reference gene, ΔCt= Ct value of control-Ct value of sample, target= the gene of interest, ref= endogenous control gene, control= untreated sample, and sample= experimental sample (Pfaffl, 2001)†.
2.8. RNA Sequencing
RNA sequencing was done on the Illumina platform through Genewiz (South Plainfield, NJ). Samples from infection were purified, and mRNA was shipped on dry ice. Samples (all were submitted in triplicate, for a total of 12 samples of 4 types): E. coli O157:H7 adhered to Caco-2 cells or IAX cells for 2 hours; or E. coli O157:H7 incubated in media (EMEM and F12K, respectively) alone for two hours.
The RNA library preparation and sequencing: library preparation was done using NEBNext Ultra RNA Library Prep Kit for Illumina per manufacturer’s recommendations. Enriched mRNAs were fragmented, first strand and second strand cDNA were synthesized, fragments were end repaired and adenylated at 3ends and ligated with universal adapter. Sequencing was done after libraries were multiplexed and clustered on one lane of a flowcell, using Illumina HiSeq 2500 with 2×100 Paired End (PE) reads.
Assembly, annotation, and analysis: assembly, annotation, and analysis of data were done using SeqMan NGen 12 software (DNASTAR, Madison, WI), using reference sequences of E. coli EDL 933 (EHEC GenBank NC_002655) and plasmid pO157 (GenBank NC_007414). Samples were submitted in triplicate and the results were averaged for fold change. Calculation of fold-change was done using DNASTAR’s Lasergene Genomics Suite and data was exported into Excel for further analysis.
Normalization of raw data was done using the RPKM (reads per kilobase of exon model per million mapped reads) equation: RPKM = (number of reads/exon length) x (1,000,000/number of mapped reads in sample). Fold change values were generated by DNASTAR’s Lasergene Genomics Suite.
2.9. Gene Deletions and Complementations
E. coli O157:H7 was used to make genomic deletions using the lambda Red recombinase system described by Datsenko and Wanner (Datsenko & Wanner, 2000).
Plasmids: all plasmids listed in Table 2.1. were grown and purified following this protocol: bacterial strains hosting plasmids were grown with antibiotics according to their respective resistance genes, and plasmids were purified using the Plasmid Midi Kit (#12145, Qiagen, Germantown, MD).
Preparation of electrocompetent cells and transformations: bacterial strain to be transformed was grown in 5 mL LB broth overnight, diluted into 100 mL LB, and grown to OD 0.4 to 0.6. Culture was incubated on ice for 20 minutes, pelleted by centrifugation at 4,000xg for 20 minutes, and pellet was resuspended in 50 mL of ice-cold 10% glycerol three times. Pellet was resuspended in 500 µL of 10% glycerol and stored at -80°C until use. Electroporation was done after at least one minute of incubation with the nucleic acid to be transformed (on ice), and pulse was 1.80 kV. Cells were immediately transported into prewarmed SOC medium, incubated 1-2 hours, and plated on appropriate agar and grown overnight†.
PCR: using the mutation primers listed in Table 2.2, PCR was performed using plasmid pKD3 as the template on an Eppendorf MasterCycler PCR System (Eppendorf/Thermo Fisher Scientific). PCR reactions were done in 50 µL volumes: 0.25 µL Taq DNA Polymerase enzyme (5 U/µL) (TQ2100-00, Omega Bio-Tek, Norcross, GA); 10X PCR buffer (TQ2100-00, Omega Bio-Tek) at 5 µL; 1.0 µL dNTPs (10mM) (30029-1, Lucigen, Middleton, WI); 1.0 µL each of forward and reverse primers (20 µM) (custom oligos, Integrated DNA Technologies, Coralville, IA), and water to 50 µL total volume. All PCR cycling conditions were done as follows, with adjusted annealing temperatures noted in Table 2.2: 95°C for five minutes; 35 cycles of 95°C for five minutes, (Annealing Tm)°C for 30 seconds, 72°C for three minutes; followed by a final extension step of 72°C for five minutes. PCR products were run in a 1.5% agarose gel in Tris-acetate-EDTA (TAE buffer; composition???) at 150 V for one to two hours to obtain clear band resolution, bands were excised from the gel, and purified using the MinElute Gel Extraction Kit (#28604, Qiagen)†.
PCR products were transformed into electrocompetent E. coli O157:H7 containing plasmid pKD119, using volumes between 2 and 5 µL at concentrations between 100 and 500 ng/µL (as measured by Nanovue spectrophotometer). Transformed cells were incubated in 1 mL of pre-warmed 37°C SOC medium and incubated at 37°C for one hour, then plated on LB containing chloramphenicol. Colonies were selected for antibiotic resistance and screened by PCR. Transformants positive for antibiotic resistance and negative for screening PCR products were grown and made electrocompetent as described above, transformed with plasmid pCP20 to cure the antibiotic resistance cassette, and screened for antibiotic resistance. Deletions were confirmed by sequencing the junctions flanking the deletions ??, if so primers listed in Table 2.2 ??? using The Pennsylvania State University’s Genomics Core Facility (University Park, PA).
Plasmid complementations of deletion strains were made using pUC18 and the complementation primers listed in Table 2.2. PCR was done using E. coli O157:H7 genomic DNA as a template; and PCR reactions, PCR cycling conditions, PCR product purification, and trasnformations were done as described.
Table 2.2. Primer Sequences
| Gene | Reference Sequence | qPCR (5-3) | Mutation (5-3) | Screening (5-3) | Sequencing (5-3) | Complementation (5-3) |
| chuA | NC_002695.1 | F:ATCCTGACCGTTGGTTCGTC
R:TCGAAGCGCCTATGATGGTC |
F:TTACCATTGATAACTCACGAAAATTTTTCCGTTACGGTGTAGGCTGGAGCTGCTTC
R:ATGTCACGTCCGCAATTTACCTCGTTGCGTTTGAGTCATATGAATATCCTCCTTAG Tm: 60°C |
F:ATCCTGACCGTTGGTTCGTC
R:TCGAAGCGCCTATGATGGTC |
F:GATATCGCCGTGCATCCG
R:GACAAAGAGGGCGTGCTTTT |
– |
| fhuE | NC_002695.1 | GATGGCTAACGTGGTGGTCA
Reverse: CCTTACGCTGGTCTGGTGTT |
f:TCAGAATTGATACGTGCCGGTAATGCTGAAATTACGGTGTAGGCTGGAGCTGCTTC
r: ATGCTTTCAACACAATTTAACAGGGATAATCAATATCATATGAATATCCTCCTTAG |
GATGGCTAACGTGGTGGTCA
Reverse: CCTTACGCTGGTCTGGTGTT |
F:TCCGATAACCTGAAAACCGAGA
R:TGCAAGCAAAATTATTCGCACA |
– |
| gapA | NC_002695.1 | F:ACTTCGACAAATATGCTGGC
R:CGGGATGATGTTCTGGGAA |
– | – | – | – |
| gapdh | (Bovine) GK000001.2 | F:CTGGGTCCACATGGCAGAAA
R:CATCCCTGCTTCTACTGGCG |
– | – | – | – |
| gapdh | (Human)
NC_000012.12 |
F:CGGGTGATGCTTTTCCTAGATTATT
R:TCCTTTTCCAACTACCCATGACTC |
– | – | – | – |
| ompC | NC_002695.1 | F:GAACGTCGGTCCAGGAAGTT
R:GCGTCTTGGCTTCAAAGGTG |
F:TTAGAACTGGTAAACCAGACCCAGAGCTACGATGTTGTGTAGGCTGGAGCTGCTT
C R:ATGAAAGTTAAAGTACTGTCCCTCCTGGTCCCAGCTCATATGAATATCCTCCTTAG |
F:AGTTGCGTTGTAGGTCTGGG
R:GCGTCTTGGCTTCAAAGGTG |
F:CCACGCGGGTAAAGCTTATT
R:TTTGGGGAGAATGGACTTGC |
F:TAAGCAAAGCTTATGAAAGTTAAAGTACTGTCCCTC
R:TGCTTAGAGCTCTTAGAACTGGTAAACCAGACCCAG |
| pigr* | (Human)
NC_000012.12 |
F:CTGGGTCCACATGGCAGAAA
R:CATCCCTGCTTCTACTGGCG |
– | – | – | – |
| pigr* | (Bovine) GK000001.2 | F:CGGGTGATGCTTTTCCTAGATTATT
R:TCCTTTTCCAACTACCCATGACTC |
– | – | – | – |
| slp | NC_002695.1 | F:GTTACCATCCTCGGCACCAT
R:CAAATGCCACACCTGGATGC |
F:GTGCTGCTAATGCGGATGCGACYTTCAAGGTTCAGTGTGTAGGCTGGAGCTGCTTC
R:TTACTGATAGGTTAAAGAGAACCAGGCCTGTGCATTCATATGAATATCCTCCTTAG |
F:AGGTGCACTCATACTCAGCC
R:TGCACCATAGCCGTAATCCC |
F:TCGCCTCAGAATCAGATGAAA
R:ATCTGCATCTTTCGGTGGTG |
F:TAAGCAAAGCTTATGGTTTTAATATTTGTTGATAAG
R:TGCTTAGAATTCTTATTTGACCAGCTCAGGTGTTAC |
Table 2.2. Primer sequences used in this study.
2.10. Co-immunoprecipitation (Co-IP) and Protein Gels
The Co-IP assay was done using the Invitrogen Dynabeads Protein A Immunoprecipitation kit (#10006D, Invitrogen/Thermo Fisher Scientific). Bacterial cultures were grown from starter culture diluted into 100 mL LB broth at an OD of 0.05 and grown with shaking to prevent sediment formation for approximately 14 hours at 37°C. Bacterial pellets were collected by centrifugation at 4°C at 4,000xg for 20 minutes and resuspended in 5 mL water for sonication. Sonication was done using a handheld sonicator (Thermo Fisher Scientific) on ice for a total of 20 minutes per sample, or until lysate turbidity was visibly reduced. A 5 mL volume of sonicated bacterial lysate was aliquoted into 1 mL samples, and one sample was used per Co-IP sample??. Untreated lysate was not incubated with protein; treated lysate was incubated with 10 µg of Recombinant Human Polymeric Immunoglobulin Receptor/PIgR (C-Fc) (pIgR-Fc) protein purchased from Novoprotein (#CI09, Novoprotein, Summit, NJ) containing an Fc tag at the C-terminus of the protein. Protein-lysate incubation was done overnight at 4°C for 16-18 hours on a rotator, and proteins collected using the Co-IP kit. Protein A coated beads (Thermo Fisher Scientific??) were prepared for use and incubated with the lysate for 30 minutes at 4°C on a rotator. Beads were collected using a magnet stand and washed twice with kit wash solution. Beads pellet was then resuspended in 10 µL of kit elution solution and 10 µL of SDS-PAGE buffer (Laemmli buffer containing sodium dodecyl sulfate (SDS), β-mercaptoethanol, and bromophenol blue) and incubated at 95°C for 5 minutes before loading into a 12% acrylamide sodium dodecyl sulfate polyacrylamide gel electrophoresis (SDS-PAGE) gel. The SDS-PAGE was run for 2 hours at 100 V at room temperature and stained with Coomasie blue (manufacturer??).
2.11. Protein Identification
All protein identifications were done at protein facilities using liquid chromatography and tandem mass spectrometry (LC MS/MS) analysis†. A total of three analyses were completed, at The Pennsylvania State Proteomics and Mass Spectrometry Core Facility (1) and the Protein Facility of the Iowa State University Office of Biotechnology (2 and 3). The protein bands were cut from the SDS-PAGE gel and processed at the respective facility. Peptide fragmentation patterns were compared to known databases of proteins of E. coli (PSU using SEQUEST and Uniprot; ISU using Mascot or Sequest HT). Raw data was analyzed using Thermo Scientific’s Proteome Discoverer Software.
Chapter 3: pIgR and Slp
3.1. Introduction
E. coli O157:H7 adherence can be described as taking place in two phases: initial adherence and intimate adherence. Initial adherence is the preliminary attachment step, allowing the infecting bacterium time and opportunity to engage its intimate adherence mechanism utilizing the T3SS, intimin, and Tir. Initial adherence in E. coli O157:H7 is mediated by factors that have not been fully defined. Putative adhesins have been reported as possibilities for contributing to initial adherence in in vitro human or animal cell models, and in in vivo animal models of infection or colonization. The variability in genetic makeup among EHEC strains lends weight to the
One approach is to studying initial adherence is to study the mechanisms employed by similar organisms and search for analogous mechanisms in E. coli O157:H7. For example, the human pIgR is known to contribute to the adherence and invasion of S. pneumoniae, and the invasion and intercellular spread of Epstein-Barr virus (EBV) during infection (Gan, Chodosh, Morgan, & Sixbey, 1997) (Hammerschmidt et al., 2002; Iovino, Molema, & Bijlsma, 2014b). Although S. pneumoniae is a Gram-positive pathogen, it is also a pathogen that targets mucosal epithelial cells with a capability to use the human pIgR as an adhesin receptor (Dave, Carmicle, Hammerschmidt, Pangburn, & McDaniel, 2004; Kouki et al., 2011). As the pIgR is also present on mucosal epithelial cells in the GI tract, we asked if E. coli O157:H7 might have a similar mechanism for initial adherence to IECs. Under normal conditions, the human pIgR system functions as an important part of the innate mucosal immune system (Hammerschmidt, Tillig, Wolff, Vaerman, & Chhatwal, 2002). Its primary functions in the intestine involve the transport and secretion of bound dIgA and unbound SC into the intestinal lumen but is also known to be hijacked by pathogens and used as a route of adherence and invasion. Write about the evidence provided by Kudva’s microarray study (this is why we thought pIgR might be involved in STEC pathogenesis)
To test for pIgR involvement in adherence, we utilized immunofluorescent microscopy for colocalization analysis and analyzed the data to measure any statistically significant relationship between adhered E. coli and the pIgR during adherence to Caco-2 cells in vitro. The human colonic epithelial cell line Caco-2 was infected with several E. coli strains and evaluated for locations of adhered bacteria and cell surface expressed pIgR protein. Using this method, we confirmed that E. coli O157:H7 has a significantly higher level of colocalization with the human pIgR protein during initial adherence, as compared to the nonpathogenic laboratory strain E. coli K12 used as a control. Additionally, other non-O157 pathogenic E. coli strains also showed significant colocalization behavior. These data support a proposed role for pIgR in E. coli O157:H7 adherence, and the relationship was further investigated by studying direct protein interactions. The commercial availability of a recombinant Fc-tagged human pIgR protein (pIgR-Fc) allowed us to demonstrate a direct interaction between human pIgR and E. coli O157:H7 and characterize the bacterial protein(s) involved in this relationship using a co-immunoprecipitation assay (Co-IP). Using this method (combined with SDS-PAGE), we detected a ~20 kDa bacterial protein with a significant binding affinity for pIgR-Fc and inferred that it was the targeted adhesin. Using LC-MS/MS for peptide sequence identification, this protein was identified as the E. coli O157:H7 outer membrane protein Slp (carbon starvation-inducible lipoprotein).
To confirm and characterize the role of Slp in initial adherence, a full deletion of the encoding gene slp was made in E. coli O157:H7. The deletion strain (Δslp), and a plasmid- complimented strain expressing slp from a plasmid [Δslp(pKD3::slp)], were used to demonstrate the importance of Slp. Using these strains, several significant findings were demonstrated. Deletion of the slp gene eliminates the colocalization phenotype with pIgR seen with wild-type E. coli O157:H7 during immunofluorescence; Δslp eliminates the observable binding in Co-IP; and Δslp shows a significant adherence deficiency to Caco-2 cells in vitro. Additionally, the plasmid-complemented strain Δslp(pKD3::slp) restores or surpasses wild-type levels of colocalization during immunofluorescence; restores binding during Co-IP; and restores adherence to Caco-2 cells. Interestingly, the plasmid-complemented slp gene in the Δslp(pKD3::slp) strain is expressed constitutively and at a higher level than the wild-type, and produces a hyper-adherent phenotype. Taken together, these data provide compelling evidence of a significant contribution of the human pIgR protein and the bacterial Slp protein to E. coli O157:H7 initial adherence.
3.2. Results
In order to effectively study initial adherence in vitro, we first had to establish a specific timeline to define initial adherence in our model. Previous literature has described initial adherence as taking place any time before three to six hours post-infection, with variability introduced through differing host cell types, infecting E. coli strains, and infection conditions. Here, we standardized the conditions of this protocol by measuring the expression of the E. coli O157:H7 intimin adhesin gene eae. Using relative eae expression as an indicator of intimate adherence provided a reproducible way to define initial adherence under the conditions used in this laboratory. Caco-2 cells were grown in standard cell culture treated six-well plates and infected with one of several E. coli strains used throughout this study. Sample collection at timepoints post-infection were within +/-5 minutes of the time indicated, and all unattached bacteria were washed away before processing for mRNA and cDNA. The fold-change (FC) of eae expression was measured using SYBR Green qPCR and calculated by the relative expression ratio method for comparative Ct analysis, using the housekeeping gene gapA for normalization, and using E. coli O157:H7 grown in cell culture media alone as the baseline for comparison. This method of analysis displayed a clear and distinctly defined pattern of eae expression, which surpassed the threshold for significance (FC ≥ 2) after four hours and increasing thereafter, indicating a clear timeline for activation of intimate adherence. Therefore, initial adherence in this model was defined as taking place from zero to three hours post-infection.
Figure 3.1. Initial Adherence Timeline in E. coli O157:H7
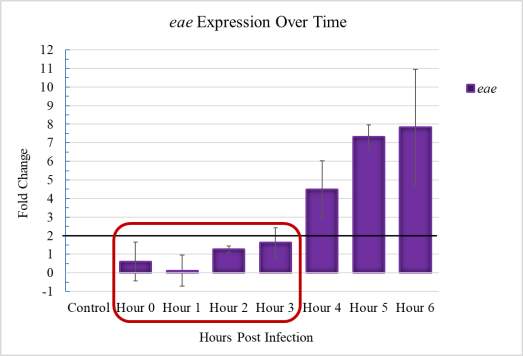
Figure 3.1. Initial adherence timeline in E. coli O157:H7. Relative expression of the eae gene during E. coli O157:H7 adherence to Caco-2 cells over six hours, shown as fold-change relative to E. coli O157:H7 grown in media alone. Indicate what has been boxed
Figure 3.2 shows colocalization patterns of E. coli K12 and E. coli O157:H7 with the pIgR. Panels A-H show immunofluorescence from three sets of emission signals (A-C and E-G), followed by a composite image of all three channels (D and H). The colocalization patterns shown are at one-hour post-infection and are representative of a larger data set used for covariance analysis.
Figure 3.2. Colocalization and Covariance of pIgR with E. coli K12 and E. coli O157:H7 Over Time
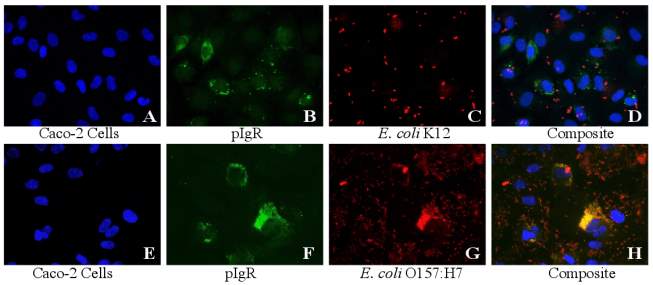
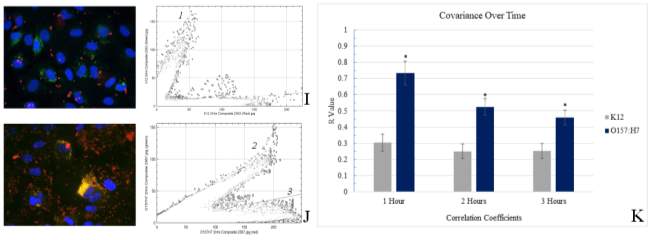
Figure 3.2. Colocalization and covariance of pIgR with E. coli K12 and E. coli O157:H7 over time. Multi-channel and composite images of E. coli K12 and E. coli O157:H7 colocalization with pIgR (A-H), representative scatterplots (I-J), and covariance (K). (A, E) Fluorescent signals of Caco-2 nuclei, Hoechst stain with emission at 497 nm, shown in blue; (B, F) fluorescent signals of E. coli, DyLight 594 with emission at 594 nm, shown in red; (C, G) fluorescent signals of pIgR protein, DyLight 488 with emission at 488 nm, shown in green; (D, H) composite images; (I, J) representative scatterplots of composite images; (K) covariance of pIgR protein with E. coli K12 and E. coli O157:H7.
Panels D and H show composite images of Caco-2 cells infected with E. coli K12 and E. coli O157:H7, respectively. In panel D, there is no apparent overlap of red and green pixels- the fluorescent signals from the 488 nm and 594 nm channels are visually distinct from each other, indicating a lack of significant colocalization between nonpathogenic E. coli K12 and pIgR. Panel H demonstrates the classic presentation of red-green pixel colocalization by the appearance of pixels of a distinctly orange color. While E. coli K12 does not show any visually apparent colocalization, panel H shows a high ratio of E. coli O157:H7 colocalization with pIgR, indicating colocalization as a specific attribute of the pathogenic strain. Panels I and J contain the scatterplots for the representative composite images shown in E and H, respectively. The scatterplots shown visualize the three populations of fluorescent signals measured for covariance analysis, with green pixels shown on the Y axis and red pixels shown on the X axis: populations of only green pixels (1), populations of only red pixels (3), and populations of colocalized red and green pixels (2). The distinct populations illustrate the high level of correlation between the location of E. coli O157:H7 and pIgR, while the lack of the central population (2) in the E. coli K12 image definitively shows low correlation. Data from ≥10 images per sample with three biological replicates were combined to calculate Person’s correlation coefficient over time, as shown in panel K as covariance. The R values seen with E. coli O157:H7 show a significant correlation between the location of adhered bacterial cells and pIgR on the Caco-2 cell surface. This covariance follows a pattern of an initial peak of approximately R=0.75 at one-hour post-infection, and gradually decreasing over time (approximately 0.55 and 0.45 at two and three hours, respectively). There is no significant correlation observed with the nonpathogenic E. coli K12 (R=0.25-0.30), and the values do not change over time.
Figure 3.3. Colocalization and Covariance of pIgR with Pathogenic E. coli Strains
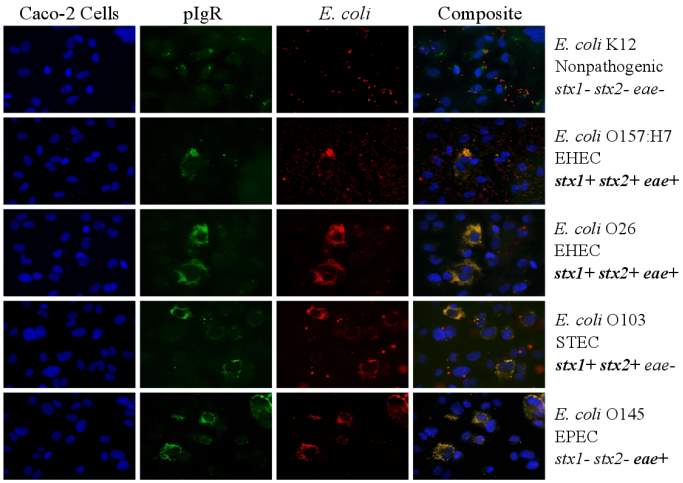
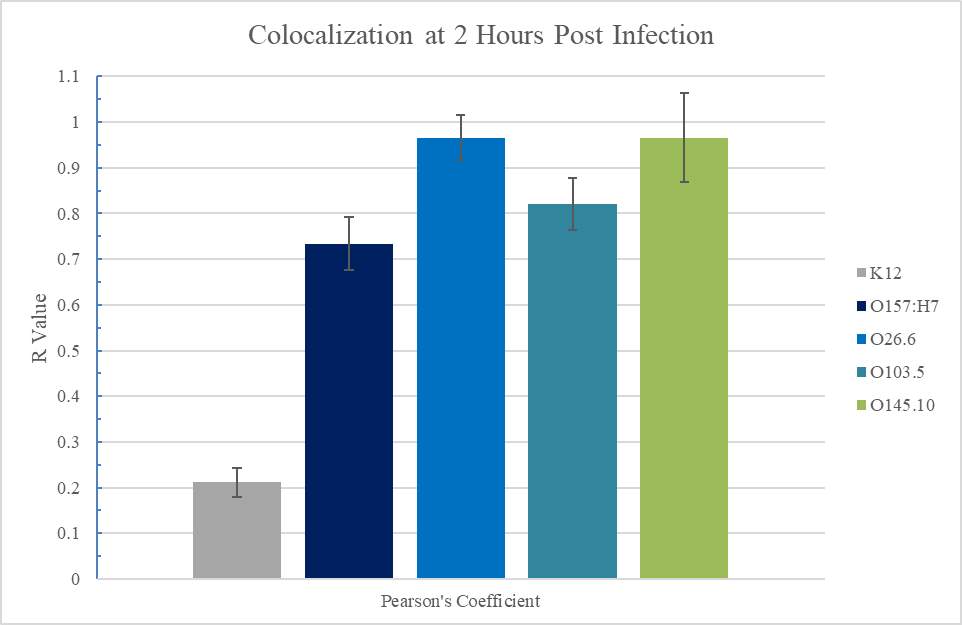
Figure 3.3. Colocalization and covariance of pIgR with pathogenic E. coli strains. Multi-channel and composite images of E. coli strains K12, O157:H7, O26, O103, and O145 and their respective colocalization with pIgR (A), and covariance (B). (A) Fluorescent signals of Caco-2 nuclei, Hoechst stain with emission at 497 nm, shown in blue; fluorescent signals of E. coli, DyLight 594 with emission at 594 nm, shown in red; fluorescent signals of pIgR protein, DyLight 488 with emission at 488 nm, shown in green; composite images; (B) covariance of pIgR protein with E. coli strains.
In Figure 3.3, several non-O157 pathogenic E. coli isolates with variations in virulence gene profiles were used to observe colocalization at two hours post-infection. Consistent with the previous data shown in Figure 3.2, E. coli K12 did not show any significant colocalization with pIgR while E. coli O157:H7 did. The non-O157 pathogenic E. coli strains and the presence or absence of several virulence genes are noted. Field isolates (serotyped and provided through the Pennsylvania State University E. coli Reference Center) were tested for the presence of stx1, stx2, and eae using PCR, and were used to infect Caco-2 cells in the same manner as E. coli K12 and E. coli O157:H7. Like E. coli O157:H7, strain O26 was positive for virulence genes stx1, stx2, and eae and was classified as EHEC for the purpose of this study. E. coli strain O103 was positive for stx1 and stx2, but is eae-negative, placing its pathotype as STEC. Strain O145 was negative for both stx1 and stx2, but positive for eae, making it an EPEC isolate. All pathogenic E. coli strains tested showed significantly higher covariance with pIgR protein than that seen with nonpathogenic E. coli K12.
Figure 3.4. Relative Gene Expression Profiles and Growth Rates
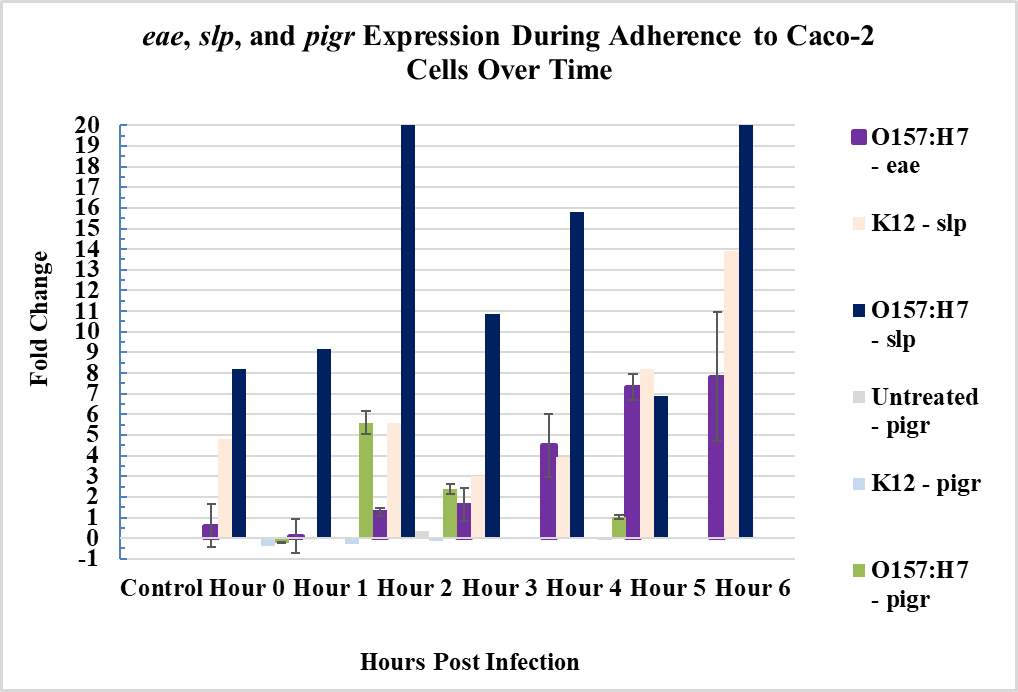
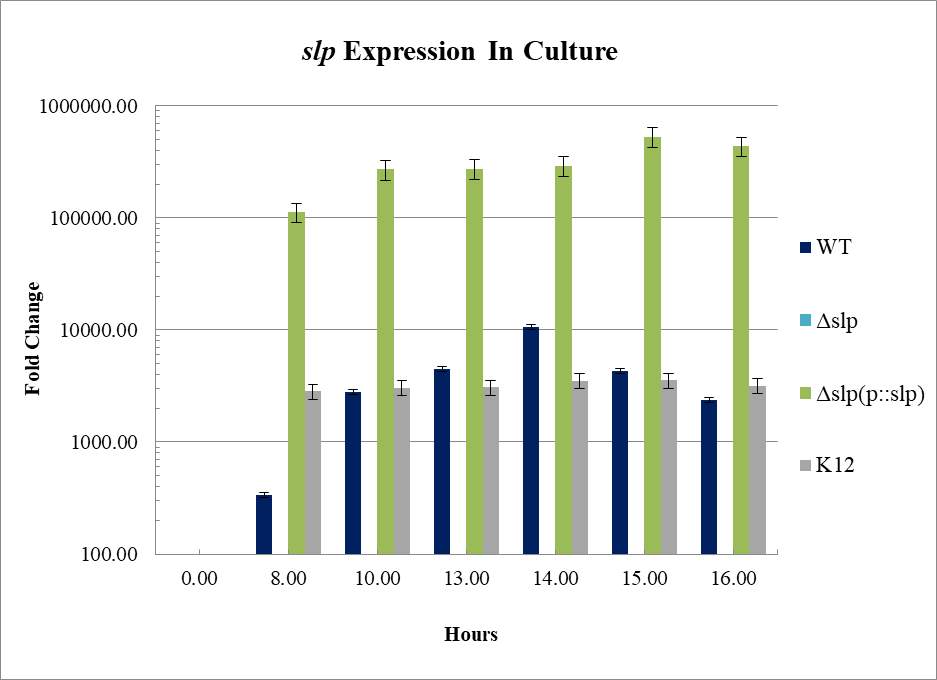
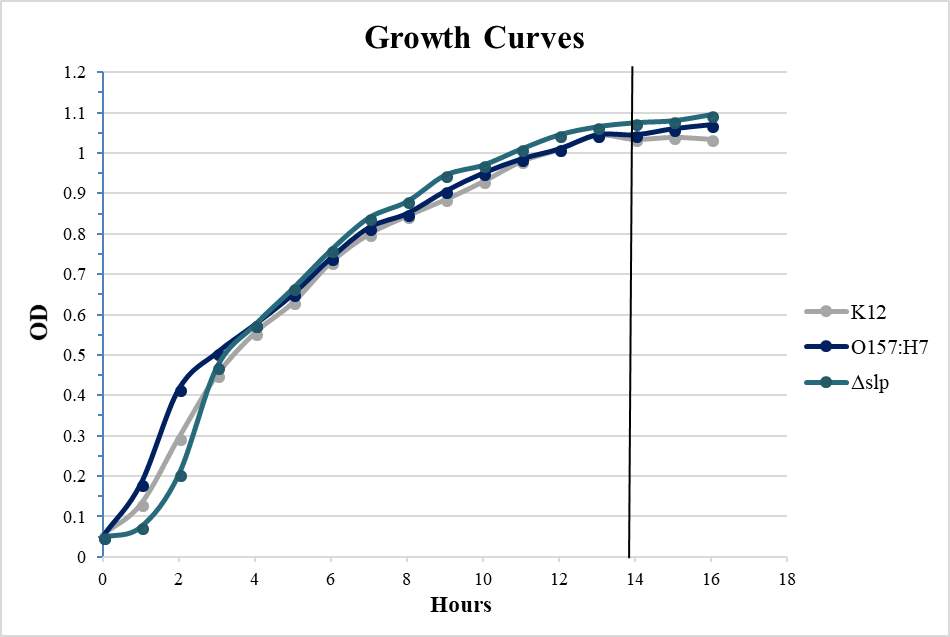
Figure 3.4. Relative gene expression profiles and growth rates. (A) Relative gene expression of genes during adherence in E. coli K12 (slp only) and E. coli O157:H7 (eae and slp) as compared to bacteria grown in media alone; relative gene expression of pigr in Caco-2 cells during adherence (untreated, infected with E. coli K12, or infected with E. coli O157:H7). (B) Relative gene expression of slp in four E. coli strains in pure culture at selected time points. (C) Growth curves in four E. coli strains in pure culture over 18 hours, as measured by optical density.
Figure 3.4 shows the relative levels of expression for the bacterial genes eae and slp, and pigr in Caco-2 cells during adherence over the course of six hours. In (A), the pattern of pigr expression in Caco-2 cells is shown alongside eae. In untreated (sterile) control cells and Caco-2 cells infected with E. coli K12, there is no significant change in pigr expression at any timepoint. In Caco-2 cells infected with E. coli O157:H7, there is an initial peak of expression (FC ≈ 5.5) at one-hour post-infection, followed by a decrease over time. The expression falls below the level of significance (FC ≥ 2) before three hours. Panel (B) shows the relative expression of the slp gene in E. coli strains K12, O157:H7, Δslp, and Δslp(pKD3::slp) in liquid culture at various intervals over 16 hours, grown (with shaking) at 37°C in LB broth. The relative expression levels of slp were measured using qPCR. As expected, Δslp did not show any detectable levels of gene expression using qPCR (as compared to the no-template negative control reaction). The Δslp(pKD3::slp) expresses the plasmid-encoded slp constitutively and at a much higher level than the wild-type. As slp is known to be transcribed at very low levels in most conditions, significant difference between wild-type baseline expression and constitutive expression is not surprising. When observing the expression of wild-type, E. coli O157:H7 shows a transient peak in expression at 14 hours, which would approximately coincide with the culture entry into stationary phase (as estimated by the growth curves shown in panel C). E. coli K12 does not show this pattern of expression.
The characterization of the interaction between E. coli O157:H7 and pIgR was further characterized using a co-immunoprecipitation (Co-IP) assay and SDS-PAGE, shown in Figure 3.5. Figure 3.5 is a representative image of multiple Co-IP assays combined for analysis (data not shown??). Lane B shows the recombinant human pIgR-Fc protein at the expected size range (as predicted by its components and the manufacturer) between 110 and 150 kDa (pIgR at 80-120 kDa plus an Fc component at ~25 kDa). Lane C shows the expected size and comparable intensity band as the unbound pIgR-Fc protein, indicating that the Fc-protein A binding capacity of the recombinant protein was successful and efficient. When the protein A-coated beads were run by themselves, there were no observable bands, indicating no interference with Co-IP results (lane D). To test for non-specific binding to the beads, wild-type bacterial lysate was incubated overnight with or without beads (preclearing) and run side by side for comparison (lane E (-) and (+) beads), which showed no identifiable difference between the two samples.
Figure 3.5. Co-immunoprecipitation of E. coli O157:H7 Proteins With Human Recombinant Fc-Tagged pIgR Protein
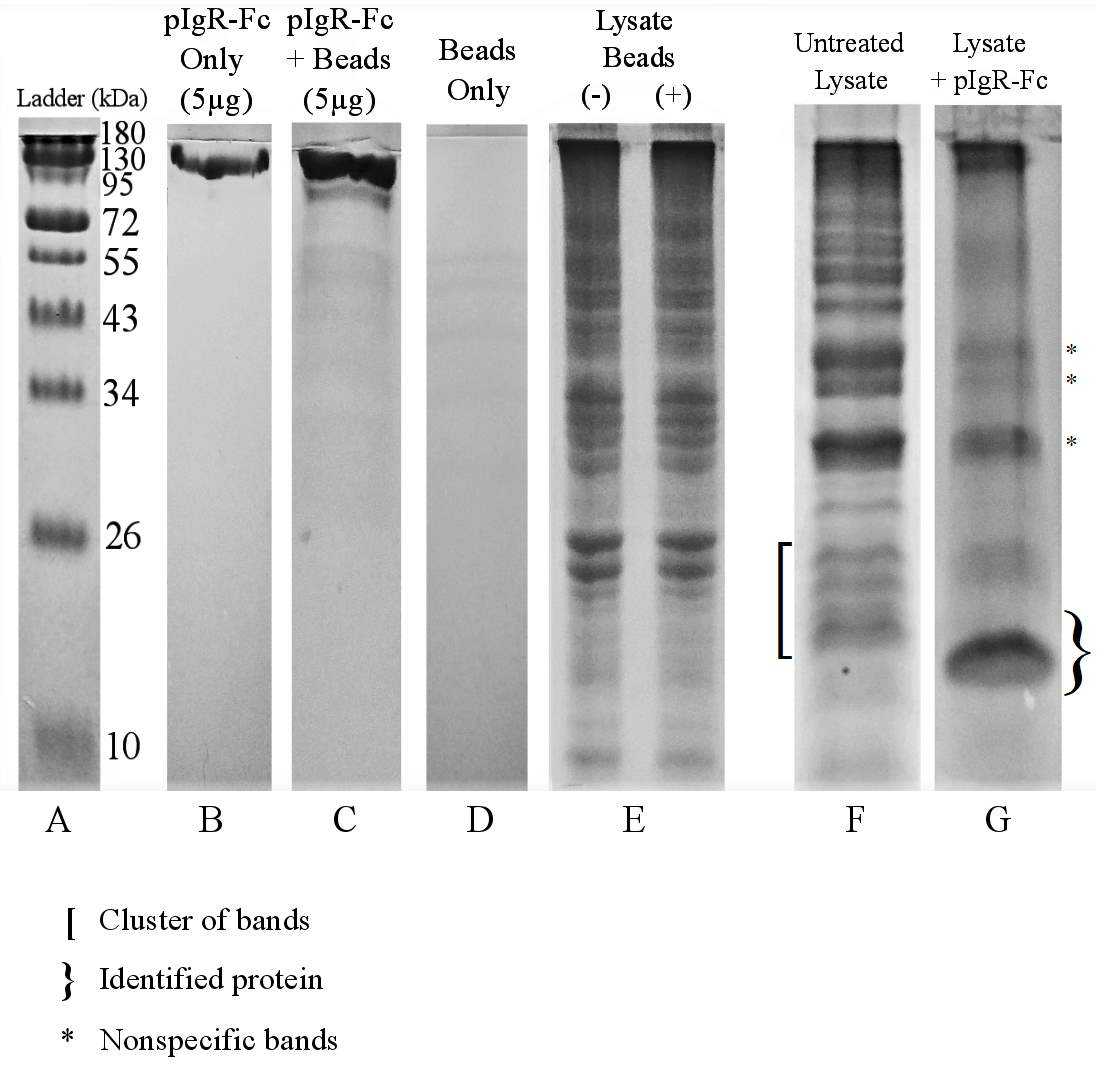
Figure 3.5. Co-immunoprecipitation of E. coli O157:H7 proteins with human recombinant Fc-tagged pIgR protein. SDS-PAGE showing the apparent sizes of proteins and lysates in the conditions used, and the locations of peptide bands of interest. What is the ladder??
To test for a direct protein-protein interaction and to ensure that no potential pIgR-interacting proteins were accidentally excluded through purification methods, sonicated whole-cell lysate of E. coli O157:H7 was used for experimental binding. Wild-type E. coli O157:H7 lysate was incubated with 10 µg of the pIgR-Fc protein overnight (16 to 18 hours) at 4°C on a rotator to prevent sediment collection inhibition of binding. The pIgR-Fc protein and any binding proteins were captured by protein A-coated magnetic beads and all recovered proteins were run. Untreated lysate prepared under identical conditions except the presence of pIgR-Fc protein is shown in lane F, and the treated lysate is shown in lane G. The appearance of a significant band between of approximately ~20 kDa indicates a probable protein-protein interaction (noted as the } identified protein). There are several other observable bands in the treated sample between 26-43 kDa, (noted as the * nonspecific bands), but they correspond in size to the most concentrated bands observed in the control (lane F), making it reasonable to conclude that they are not binding-specific. Bands seen between 26-43 kDa are most likely leftover proteins from lysate supernatant that were not completely washed away. One band in particular at about ~45 kDa is more highly concentrated but corresponds in size to the most concentrated protein band in the lysate making it unlikely to represent a protein-protein binding interaction. In the untreated sample, a small cluster of bands between ~20-25 kDa is visible (noted by the [ cluster of bands), but none are sufficiently concentrated to produce the thick band observed after Co-IP. The most prominent band in the treated sample is an unknown peptide with an estimated size of ~20 kDa. The concentration of the unknown ~20 kDa protein was significantly increased by the process of incubation and Co-IP, making it a promising candidate as the unknown adhesin. The image in Figure 3.5 represents multiple replications confirming the same result, and this band was excised for identification using liquid chromatography and tandem mass spectrometry (LC MS/MS) analysis.
All protein identifications were done at protein facilities using LC MS/MS analysis. A total of three analyses were completed, at The Pennsylvania State University’s Proteomics and Mass Spectrometry Core Facility (1) and the Protein Facility of the Iowa State University Office of Biotechnology (2 and 3). The protein bands were cut from the SDS-PAGE gel and processed at the respective facility. Briefly, the proteins were cleaned of contaminants (reducing agents, detergents, acrylamide, and Coomasie blue stain), digested into peptides with trypsin, fragmented and separated by LC, then analyzed with tandem MS analysis (MS/MS). The fragmentation patterns were compared to known databases of proteins of E. coli (PSU using SEQUEST and Uniprot; ISU using Mascot or Sequest HT). The results provided a short, consistent list of possible outer membrane protein identities. In table 3.1, the results of the analysis are shown.
Table 3.1. Protein Identification Using LC MS/MS
| Protein ID | Protein Description | Reference Sequence | Accession # | Average % Coverage | % Coverage | # AAs | kDa |
| *Slp | Outer membrane protein Slp | K12 | P37194 | 54.9 | 45.2 | 188 | 21.0 |
| O157:H7 | EGD63840.1 | 64.6 | 243 | 27.3 | |||
| *Pal | Peptidoglycan-associated lipoprotein | K12 | P0A912 | 53.8 | 34.1 | 173 | 18.8 |
| E. coli | API13876.1 | 73.4 | 173 | 18.8 | |||
| *OmpW | Outer membrane protein W | K12 | P0A915 | 49.8 | 42.9 | 212 | 22.9 |
| E. coli | APA42311.1 | 56.6 | 212 | 22.9 | |||
| *OmpX | Outer membrane protein X | K12 | P0A917 | 44.7 | 34.5 | 171 | 18.6 |
| E. coli | API30670.1 | 55.0 | 171 | 18.6 | |||
| OmpC | Outer membrane protein C | K12 | P06996 | 15.4 | 8.2 | 367 | 40.3 |
| O157:H7 | EGD63379.1 | 22.6 | 367 | 40.5 | |||
| OmpA | Outer membrane protein A precursor | O157:H7 | EGD61976.1 | 22.2 | 40.7 | 354 | 38.1 |
| O157:H7 | EGD61976.1 | 3.7 | 354 | 38.1 |
* Proteins present in all three analyses.
Table 3.1. Protein identification using LC MS/MS. Summary of the outer membrane proteins found to be possible identifications of the unknown ~20 kDa protein recovered from Co-IP. Proteins are listed in order of decreasing sequence coverage, and proteins that were identified in three of three analyses are noted.
Using the results from three separate experiments, a short list of candidate proteins was compiled. Irrelevant results were excluded based on size (larger than 50 kDa), species (i.e. human keratin contamination), and subcellular location (not OMPs). Of the six total identified proteins, four were reported in all three analyses, which are listed in order of decreasing sequence coverage. While this did not discount the remaining two out of hand; their sizes (38 and 40 kDa) made them less likely candidates. The first four proteins (Slp, OmpW, OmpX, and Pal) were selected for further investigation. All were OMPs with sizes between 15 and 25 kDa. We selected the encoding genes of these proteins for attempted deletion mutations, resulting in an E. coli O157:H7 strain missing the gene slp (Δslp) and a plasmid-complimented strain (Δslp(pKD3::slp)). The results of Co-IP with these strains is shown in Figure 3.6.
Figure. 3.6. Co-Immunoprecipitation of Fc-Tagged pIgR Protein with E. coli O157:H7 Δslp and E. coli O157:H7 Δslp(pKD3::slp) Strains
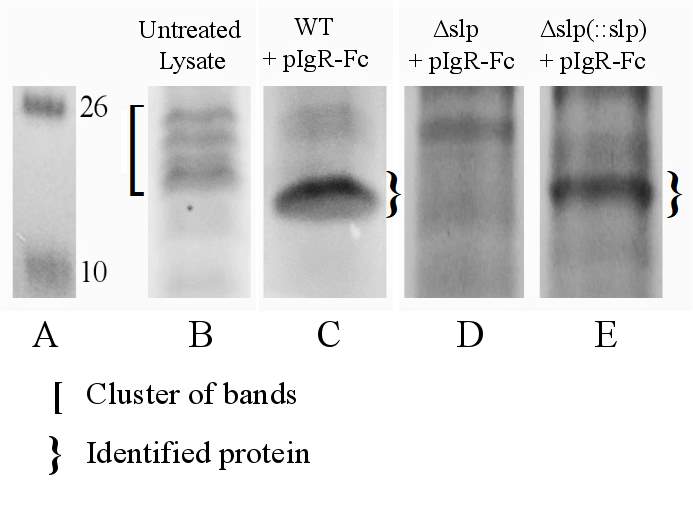
Figure. 3.6. Co-Immunoprecipitation of Fc-Tagged pIgR Protein with E. coli O157:H7 Δslp and E. coli O157:H7 Δslp(pKD3::slp) Strains. SDS-PAGE of Co-IP with wild-type E. coli O157:H7, Δslp, and Δslp(pKD3::slp) strains.
Figure 3.6 shows the SDS-PAGE of the proteins recovered from a Co-IP assay using the Δslp and Δslp(pKD3::slp) strains. Lanes B-E show wild-type E. coli O157:H7 untreated lysate, wild-type E. coli O157:H7, Δslp, Δslp(pKD3::slp), respectively. Lane C shows a distinct band of ~20 kDa, which is not visible in the Δslp sample (lane D), and Δslp(pKD3::slp) shows a restored binding phenotype (lane E) comparable to the wild-type.
Figure 3.7. Colocalization and Covariance of pIgR with E. coli O157:H7 Δslp and E. coli O157:H7 Δslp(pKD3::slp) Strains
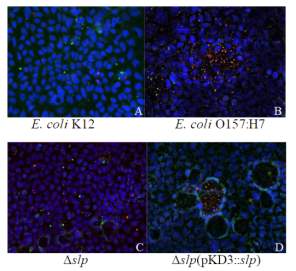
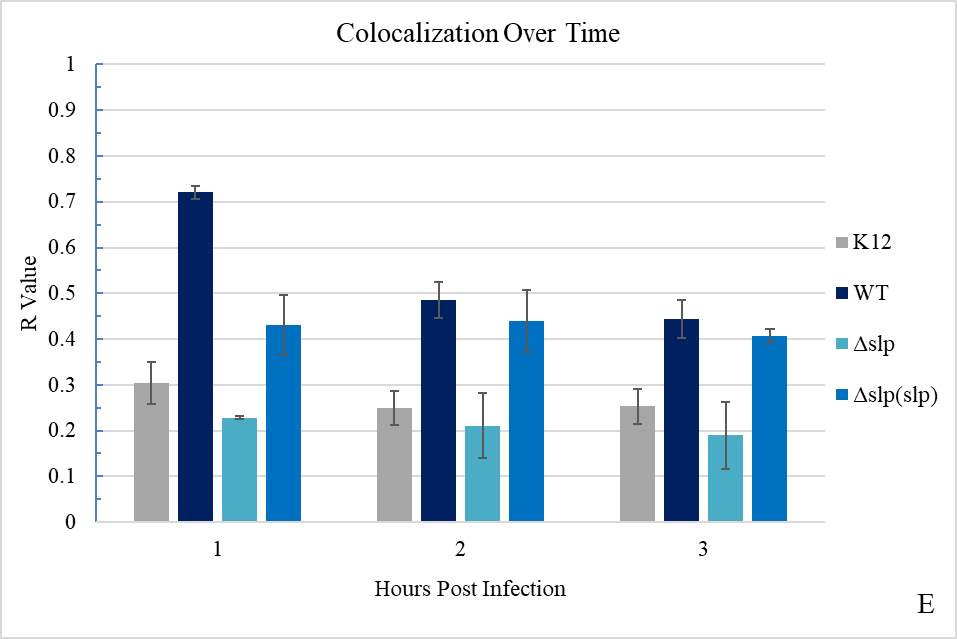
Figure 3.7. Colocalization and covariance of pIgR with E. coli O157:H7 Δslp and E. coli O157:H7 Δslp(pKD3::slp) strains. Multi-channel and composite images of E. coli O157:H7 strains Δslp and Δslp(pKD3::slp) and their respective colocalization with pIgR (A), and covariance (B). (A) Fluorescent signals of Caco-2 nuclei, Hoechst stain with emission at 497 nm, shown in blue; fluorescent signals of E. coli, DyLight 594 with emission at 594 nm, shown in red; fluorescent signals of pIgR protein, DyLight 488 with emission at 488 nm, shown in green; composite images; (B) covariance of pIgR protein with E. coli strains listed.
Figure 3.7 shows the colocalization phenotype and covariance of E. coli K12, E. coli O157:H7, Δslp, and Δslp(pKD3::slp) over zero to three hours of adherence. The E. coli K12 samples do not show any statistically significant colocalization or any changes over time. E. coli O157:H7 shows a significant colocalization at all timepoints, with the highest correlation seen at one-hour post-infection. These results are consistent with previous data. The Δslp strain demonstrates significantly diminished colocalization, on par with the levels observed in the nonpathogenic E. coli K12. The Δslp and E. coli K12 correlation hovers between 20-30% and does not change over time, with both strains indicating that there is no relationship between their adherence and the location of pIgR. The Δslp(pKD3::slp) shows some statistically significant covariance with pIgR, between 40-45% across all time points.
Figure 3.8. Adherence of E. coli Strains to Caco-2 Cells
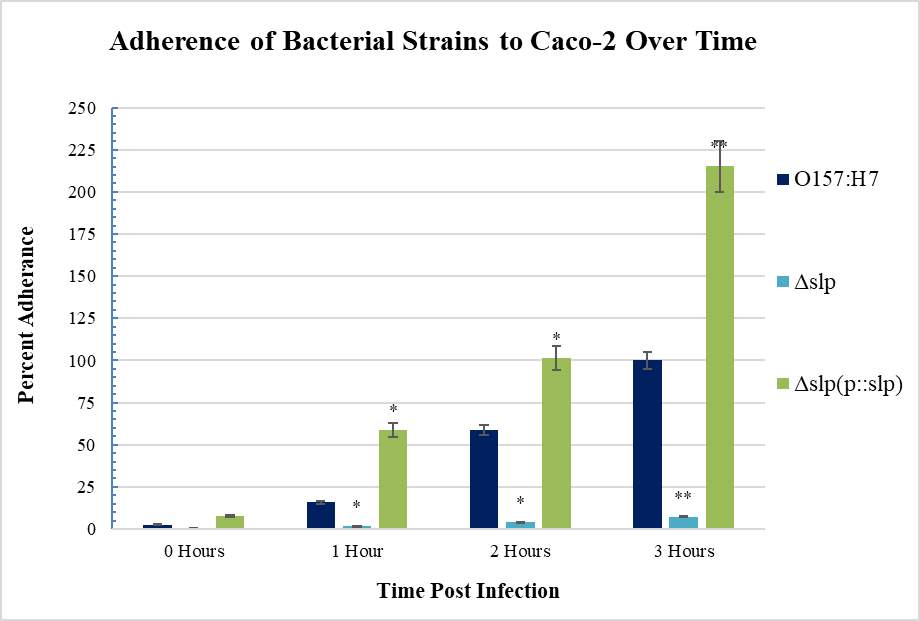
Figure 3.8. Adherence of E. coli strains to Caco-2 Cells. Relative adherence of wild-type E. coli O157:H7, E. coli O157:H7 Δslp, and E. coli O157:H7 Δslp(pKD3::slp) over three hours, where maximum wild-type adherence is 100%. (indicate what is the for??)
Adherence was quantified using a standard adherence assay. Infection of Caco-2 cells was carried out as described previously, and adhered bacteria were collected and counted using serial dilutions to measure colony forming units (CFUs) (mean of three biological replicates is shown). In Figure 3.8, the relative adherence of wild-type E. coli O157:H7, Δslp, and Δslp(pKD3::slp) is shown as proportional to the maximum number of wild-type E. coli O157:H7 bacteria adhered (recovered), which was at three hours post-infection. As expected, wild-type shows a steady increase in adherence over time. However, Δslp shows a very significant adherence deficiency at all timepoints. Δslp adherence does increase slightly over time, but never recovers more than 10% of the wild-type adherence levels, even after three hours. Conversely, Δslp(pKD3::slp) shows a hyper-adherent pattern, with adherence surpassing wild-type levels at all timepoints. At three hours, the number of adhered Δslp(pKD3::slp) cells is more than double the wild-type level.
In addition to examining colocalization phenomenon in human colonic cells in vitro, we wanted to determine the relationship between pIgR and adherence in bovine intestinal cells. In adult bovine intestinal colonization, E. coli O157:H7 (and other EHEC) are found almost exclusively in a small area of tissue called the recto-anal junction (RAJ), primarily on areas containing lymphoid follicles. Using cells collected from this tissue in adult cattle, recto-anal junction squamous epithelial cells (RSE cells), bovine cells were evaluated for any relationship with pIgR and adherence.
Figure 3.9. Bovine Intestinal Cells and the pIgR
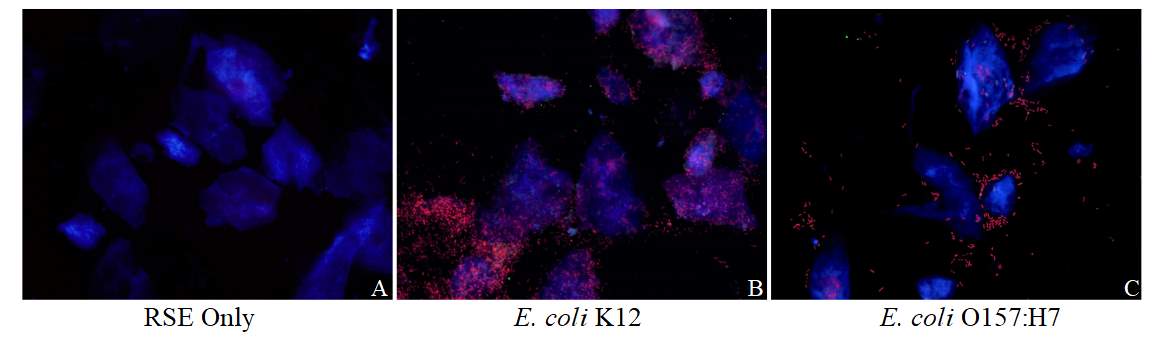
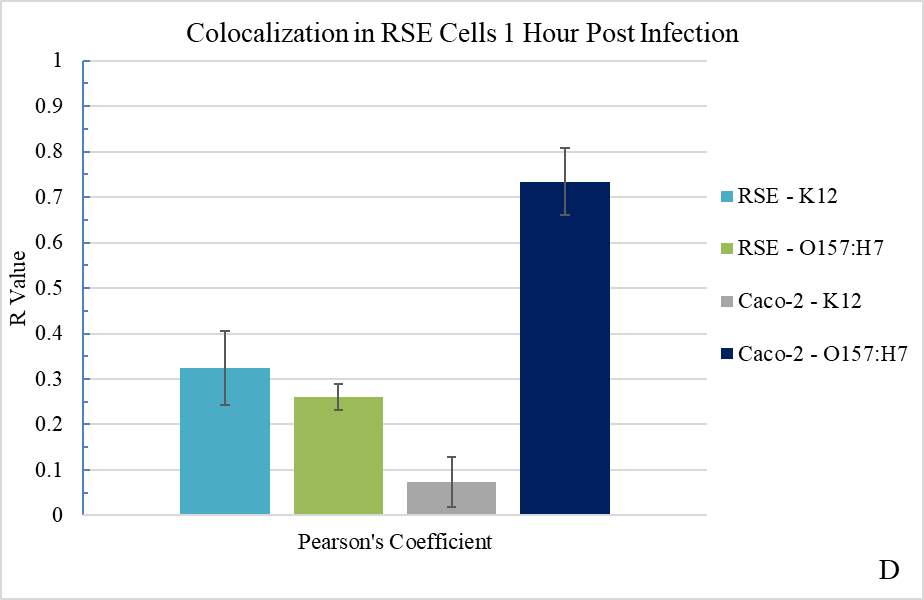
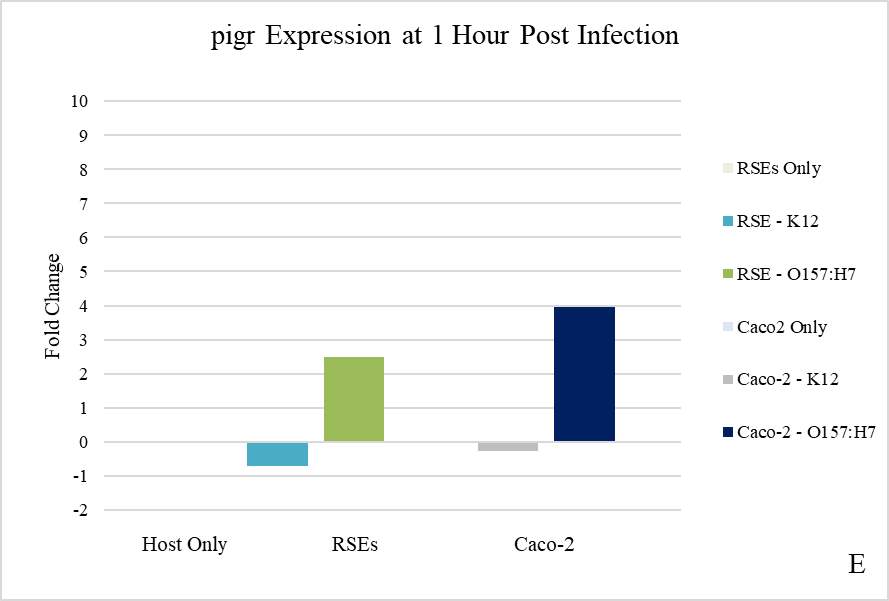
Figure 3.9. Bovine Intestinal Cells and the pIgR. (A-C) Composite images of colocalization, (D) covariance of pIgR with E. coli K12 and E. coli O157:H7, and (E) relative gene expression of pigr in bovine and human IECs in vitro. All data collected at one-hour post-infection.
As shown in Figures 3.9 A-C, RSE cells did not show any visually apparent colocalization, and (D) did not demonstrate any significant covariance. RSE cells showed similar or slightly higher levels of covariance as E. coli K12 has shown on Caco-2 cells, although the E. coli K12 sample in this experiment has a lower than average R value. RSE cells also did not show as much difference in pigr expression when compared to Caco-2 cells. In response to one-hour adherence of E. coli O157:H7, Caco-2 cells show a four-fold increase in pigr expression, while the RSE cells showed only a two-fold increase. Neither host cell showed any significant change when infected with E. coli K12.
3.3. Discussion
Colocalization as Evidence of Pathogen-specific Initial Adherence Phenomenon
Colocalization is a well-accepted method of uncovering previously undefined interactions between organisms, proteins, or molecules. This technique has been used extensively in host-pathogen research to unearth new information about mechanisms of pathogenesis, including adherence. A research group studying E. coli O157:H7 in cattle used this approach in 2009 to suggest the role of the H7 protein (flagella) as an adhesin in vivo (Mahajan et al., 2009). In combination with other data, they demonstrated this function using colocalization measurements before and after the deletion of the gene encoding H7. In 2014, a new adherence phenomenon involving the pIgR and another host protein was uncovered, during the adherence of S. pneumoniae to human brain microvascular endothelial cells (HBMEC) in vitro and in the brain tissue of mice experimentally infected with this pathogen. In both cases, it was shown that S. pneumoniae colocalized with host proteins pIgR and PECAM-1, and was validated using other protein-binding assays (Iovino, Molema, & Bijlsma, 2014a). The accuracy of colocalization analysis is dependent on several variables such as minimized background noise, similar fluorescence intensity across channels, and resolution of images (Kopan, Goate, Dunn, Kamocka, & McDonald, 2011). It is also important to note that all colocalization analysis is subject to the limits of optical resolution in the microscope used, and that no conclusion be drawn outside of a reasonable scale within the ability of the microscope to resolve the observed structures. All colocalization data and analysis presented has been subject to verification using other techniques that were designed specifically to measure direct interactions between proteins in vitro. These results have been used to quantify adherence phenotypes in various experimental conditions and provide evidence-based justification for pursuing the pIgR protein in the study of initial adherence.
Colocalization is measured using covariance to describe the correlation between the location of two fluorescent signals. Pearson’s correlation coefficient (PCC) measures the covariance of red and green pixels and is expressed as the probability (R) of finding a red and green pixel overlapped at any point in the images used. Probabilities are based are based on a linear regression of all positively identified fluorescence signals in both channels, with the slope of the line indicating the correlation of the locations of red and green pixels. An R of 1 denotes a 100% positive correlation (all red and green pixels are found overlapped) to -1 for a 100% negative correlation (no red and green pixels are overlapped). Representative scatterplots of covariance data are shown in Figure 3.2 for reference. Covariance was normalized for variable fluorescence intensity and analyzed using colocalization analysis software to avoid bias, and all samples (strain plus time point) represent a minimum of 10 images per slide and three biological replicates each. For the purposes of discussion, R values will be described using their corresponding percent values; i.e. where R = 0.5, the correlation can be described as 50%. Figures 3.2 and 3.3 show the colocalization phenotypes and covariance of different E. coli strains with pIgR. The difference between nonpathogenic E. coli K12 and virulent E. coli O157:H7 is visually evident in Figure 3.3. In panel H, there is the clearly observable presence of orange pixels, and the notable absence of such coloring in panel D. In red/green colocalization, the complete overlap of red and green pixels produces an easily distinguished orange pixel. Although quantification and verification was completed, it was quickly evident that the pathogenic strains of E. coli tested produced a significantly higher level of colocalization than E. coli K12. Figure 3.2 shows a pattern of covariance consistent with the proposed role in initial adherence, with a peak of covariance at the earliest timepoint (one hour) and falling gradually at two and three hours post-infection. In the study of initial adherence factors, it is expected that the highest activity of an adhesin would be at the earliest time points and would gradually decrease as their activity is no longer needed (due to engagement of the intimate adherence mechanism). The covariance shown for E. coli O157:H7 shows this pattern, with the peak covariance of 75% at one hour, and decreasing to 45% after three hours. The presence of this pattern, which is inversely correlated with the pattern of eae gene expression shown in Figure 3.1, indicates the presence of an initial adherence mechanism involving the pIgR. E. coli K12 does not show any such patterns or changes over time, which is consistent with a pathogen-associated specific adherence mechanism. The covariance observed represents a significant correlation, which can best be explained by a direct role of pIgR in initial adherence, but the possibility of an indirect effect on the pIgR system, or compounding factors affecting both variables, remained. The pIgR is a major player in mucosal immunity, and its upregulation (in both transcription and translation) can be induced a number of factors. Pathogenic E. coli is well known to have many mechanisms by which it affects the expression of pIgR protein in a host cell.
Protein Identification
In this study, we identified the Slp protein as the factor (adhesin ???) responsible for E. coli O157:H7 binding to pIgR protein. The Co-IP assay produced a distinct, unique band of ~20 kDa, which was significantly more highly concentrated in the treated sample than in the untreated sample. Identification through LC MS/MS resulted in six possible proteins based on subcellular location (OMPs) and size (˂50 kDa). Of these six proteins, four were identified in all three analyses and were closest in size to the ~20 kDa band. OmpX, Pal, Slp, and OmpW are outer membrane proteins with molecular weights of ~18, ~19, ~21, and ~23 kDa respectively; and most likely represent the cluster of four bands observed in the untreated sample in Figure 3.5. This cluster was observed in all Co-IP gels (data not shown). As these proteins have very similar sizes, it would be unsurprising to find that imperfect resolution caused the presence of multiple similar-sized proteins to be present in each sample used for LC MS/MS. This would explain the consistency of identified proteins in all three analyses, and the relatively high sequence coverage. Because of the limitations of resolution in this standard SDS-PAGE gel, it is not possible to make any statements about which protein may be the one appearing in the Co-IP sample. Accordingly, we pursued all four of the identified proteins as the potential adhesin.
The OmpA and OmpC proteins have potentially interesting roles in virulence, and both are thought to be recognized by host immune system. Deletion of OmpA has been associated with increased stress sensitivity (detergents, pH, and osmolarity) and deletion of OmpC demonstrated increased resistance to antibiotics and bactericidal mechanisms in human serum (Wang, 2002) (Liu et al., 2012). Studies of these proteins in E. coli have been in different pathotypes and conditions, so any potential role in EHEC or EHEC adherence is not well characterized. Although OmpA and OmpC (or their precursors) were identified in two out of three analyses, they have molecular weights of 38.1 and 40.5 kDa (respectively), effectively excluding them from the possible identities of the cluster seen at 15-25 kDa.
Pal (peptidoglycan-associated lipoprotein), at 18.8 kDa, has no currently known role in pathogenesis, but it is a crucial component of the bacterial cell membrane. It interacts with a variety of other proteins related to many different cell functions, and is part of an operon that is responsible for the linking of the inner and outer membranes, and general membrane stability (Shin, Lu, Cai, & Kim, 2005) (Kovacs-Simon, Titball, & Michell, 2011). Its presence is may not be due to any direct role in pathogenesis, but could simply as a common and crucial protein required for E. coli growth and survival regardless of the conditions (Cascales & Lloubès, 2004).
OmpW (outer membrane protein W), at 22.9 kDa, is a receptor for the E. coli colicin S4, and has been shown to be upregulated in response to osmotic and oxidative stress (resulting in a stress-sensitive phenotype) and in viable but not culturable (VBNC) conditions (Choi et al., 2014). Like other Group A colicins, S4 is plasmid encoded and utilizes the Tol system for uptake into target cells (Pilsl, Smajs, & Braun, 1999). Like Pal, it does not seem have any known direct associations with virulence. Rather, it seems to be part of a large general group of proteins related to membrane integrity, and possibly during stress. But also, like Pal, this fact does not exclude it from the possibility of as-of-yet unknown functions.
OmpX (outer membrane protein X), at 18.6 kDa, in contrast to the other proteins identified, OmpX is part of a family of proteins known to be involved in virulence and adherence (Vogt & Schulz, 1999). OmpX has been shown to play a role in adherence involving type 1 fimbria in other strains of E. coli, but as E. coli O157:H7 does not express type 1 fimbriae this particular role is not likely to be relevant here (McWilliams & Torres, 2014). Its role in adherence specifically in E. coli O157:H7 is unknown. OmpX has significant homology to the Ail protein in Yersinia enterocolitica and PagC in Salmonella enterica serovar Typhimurium, which are both associated with serum resistance (Rivas, Fegan, & Dykes, 2008).The significance of this protein in regards to adherence is unclear.
The Slp Protein, AFI, and Adherence
As shown in Figure 3.6, Slp was demonstrated to be the protein binding to the pIgR. The Slp is a 22 kDa lipoprotein primarily known to be expressed in E. coli during entry into stationary phase and during carbon starvation. Its function is not completely clear, though it has generally been accepted that one of Slp’s probable functions is related to membrane stability during stationary phase. Interestingly, the Δslp strain was observed to be slightly more easily lysed in water than the wild-type strain (data not shown), which further supports this proposed function. Bacterial lipoproteins are a broad range of proteins and have been known to be involved with many virulence functions, including adherence. Other genes with low levels of sequence homology have been identified in other Gram-negative bacteria or enteric pathogens, which suggests the possibility of a similar role among some limited classes of bacteria. Its encoding gene (slp) expression is extremely low at every other growth stage, only being upregulated significantly during entry into stationary phase growth or during carbon starvation. The slp sequence is located on a genomic acid fitness island (AFI) along with several other defined and undefined genes and operons (Carter, Louie, et al., 2012). The slp is located in a small operon and is transcribed along with the gene yhiF (which encodes a putative LuxR family regulator protein) (Zhao & Houry, 2010). Of the AFI proteins, Slp and YhiF are not well characterized (Tramonti et al., 2008). Several studies have attempted to illuminate their regulation and function, but the data are not conclusive. Several studies have outlined different potential functions of Slp and YhiF, and how they may function together or separately. While the research has not yet reached a consensus, there have been some studies with interesting implications about Slp, the AFI, and the roles of acid resistance (AR) in adherence and gene regulation.
It is notable that Slp contributes to initial adherence and is involved in acid stress response and resistance, because pH is a potent signaling factor in E. coli O157:H7 (Barnett Foster, 2013). Particularly with the Gad system, low pH results in a gene expression profile fit for initial adherence. Low pH and Gad-related regulators will downregulate LEE-encoded effectors not required at that stage (i.e. eae and intimate adherence related genes), and upregulate genes related to adherence and motility (Barnett Foster, 2013; Foster, 2004; Morgan et al., 2015; Tramonti et al., 2008). GadE, the Gad master regulator, is known to affect the expression of genes outside the AFI both directly and indirectly. An acid- or Gad system-influenced mechanism of expression would be beneficial for activation of initial adherence factors, as it is a consistent and robust signal present prior to the environment where initial adhesins would be required for effective colonization. Multiple virulence and adherence genes are directly or indirectly affected by low pH, with many factors converging into at least partial regulation by this pathway, and utilization of the same pathways is much more reliable and efficient during pathogenesis than having many independent mechanisms. The convergence of regulatory systems involving adherence and virulence also has implications regarding targets for attenuating virulence, and the discovery of other potential initial adherence factors based on the pursuit of pH-influenced genes that may have a higher probability of involvement in initial adherence or other closely related functions. Regulatory mechanisms also provide
Resistance to acid stress is a major component of E. coli O157:H7 virulence, and pH is a potent signaling factor in virulence gene regulation. The role of GadE and other acid-response genes in the regulation of the LEE and other virulence/adherence effectors invites further questions into the mechanisms of initial adherence, given the current gap in knowledge between AR signaling and response steps and intimate adherence steps during colonization and pathogenesis. Given the complexity and sensitivity of AFI regulatory mechanisms and effects, further study is required to fully understand these systems and how their gene products, such as Slp, affect pathogenesis in vivo.
As described in Chapter 3, the colocalization analysis used in this study shows a specific and statistically significant interaction between E. coli O157:H7 and the human pIgR. Here, we show that this interaction is taking place using the bacterial protein Slp. Using the Δslp strain, the colocalization observed with wild-type (WT) strain is eliminated at all timepoints. The levels measured are comparable with those of the nonpathogenic E. coli K12, which is a statistically insignificant phenomenon. It’s possible that the deletion of the slp gene has caused some downstream effects and repressed the activity of another protein, which would indirectly abolish binding without being the actual adhesin. This possibility opens some questions, because full restoration of the WT phenotype was not achieved. The plasmid-encoded slp gene only partially restores the covariance seen in the WT. The R value for Δslp(pKD3::slp) does not change over time, which is what would be expected in a constitutively expressing strain. It is possible that there is some kind of interference with this particular set of fluorescent slides, and the experiment bears repeating. ???
Adherence
The slp was the first gene to be successfully deleted and complimented among the list in Table 3.1. The Δslp and Δslp(pKD3::slp) showed a normal growth curve as compared to the wild-type E. coli, and the gene expression data shown in Figure 3.4 shows the constitutive over-expression of slp in the Δslp(pKD3::slp) strain, which was useful in the observations of Slp function in this work. Consistent with data outlined thus far with colocalization and gene expression, the wild-type strain showed a steady increase of adhered cells over time. Compared to wild-type, the effects of the Δslp were striking. Especially pronounced at earlier time points, the deletion of slp resulted in a significant deficiency in adherence to Caco-2 cells. Using the total adherence of the wild-type strain at three hours as the mark for 100% adherence, the Δslp showed almost a ten-fold decrease in adherence, while the Δslp(pKD3::slp) strain exhibited hyper-adherence at all time points. The increased adherence of the Δslp(pKD3::slp) strain provides further compelling evidence of Slp’s direct contribution to initial adherence. The degree to which Δslp affected adherence to Caco-2 cells was somewhat unexpected, as we expected to see the effects of other alternative or compensatory adherence mechanisms. The slp gene is transcribed with yhiF, but the adherence deficiency in Δslp suggests that yhiF either does not contribute to adherence or is not sufficient to confer any adherence itself.
Bovine Cells
There are many studies regarding the adherence and colonization factors involved in bovine colonization by EHEC. A 2007 study by Li et. al utilizing cDNA microarrays investigated global changes in bovine gene expression in response to EHEC infection and colonization (Li & Hovde, 2007). The bovine-specific microarray contained 13,824 total spots, 4,608 bovine-expressed sequence tags, and 1,676 unique genes. 4 different groups of 5-10 month-old steers were rectally inoculated with one of four different inoculates: LB (negative control), E. coli O157:H7 (experimental strain), SH2 (non-O157 STEC), or SH3 (non-colonizing EHEC negative control). After inoculation, RAJ tissue was collected at 6 hours, and then 1, 3, 7, and 14 days and used for mRNA isolation. Statistical significance in differential gene regulation was defined as ≥1.5-fold change plus a p value ≤0.05. Overall, 49 genes were differentially expressed in response to E. coli O157:H7, and 32 were differentially expressed in response to both E. coli O157:H7 and non-O157 strain SH2. Expression of the polymeric immunoglobulin receptor (pigr) was significantly higher in all three bacterial inocula, but more pronounced with SH2 (Li & Hovde, 2007). At six hours post-infection, the pigr was increased 1.93-fold with O157:H7, 3.51-fold with non-O157 SH2, and 2.03-fold with the non-colonizing EHEC control strain. This study supported the question of pIgR involvement in bovine cell adherence mechanisms, but the data shown in Figure 3.9 indicate that this is not the case. Given the variable range of AFI gene regulation between E. coli strains, it follows that this set of genes would not necessarily partake in the same mechanisms to initiate adherence in a different host. Additionally, the bovine rumen is a different environment and contains different signals than the human GI tract, implying that virulence or adherence gene regulation patterns would not be the same between hosts.
The RSE cells were used to measure the levels of colocalization of E. coli K12 and E. coli O157:H7 with the bovine pIgR present on the RSE cell surface. Infected RSE cells and uninfected controls were stained and imaged in the same manner as Caco-2 cells, and colocalization was quantified. Somewhat surprisingly, there was no significant difference in colocalization between E. coli K12 and E. coli O157:H7 on RSE cells at one-hour post-infection. Using Caco-2 cell samples as comparison, the levels of colocalization in RSE cells were insignificant. In contrast, the bovine pigr gene did show a small upregulation during adherence, although only half that seen with Caco-2 cells (2-fold and 4-fold, respectively). The pigr expression is consistent with previous studies in bovine hosts (Li & Hovde, 2007), it is slightly incongruous with the lack of colocalization; however, the fold change in expression was quite small and may not represent an adherence-related response. Overall, these data do not support the idea that bovine pIgR is related to asymptomatic carriage or tissue tropism but provide evidence that the pIgR-EHEC colocalization observed in Caco-2 cells may be human host-specific.
The authors of the microarray study mentioned above speculate that there is a weak immune response at the site of colonization (not strong enough to clear infection), but the earliest timepoint observed was six hours post-infection so the data there is inconclusive for interpretation involving pigr gene expression or colocalization at one-hour post-infection. Any other phenomenon (or lack thereof) at earlier timepoints would have been missed. The observation of similar gene expression at two hours post-infection here and six hours post-infection in the microarray study lend weight to the conclusion that pIgR is not likely to be undergoing the same phenomenon described in Caco-2 cells during initial adherence.
Chapter 4: RNA Sequencing and Gene Deletions
4.1. Introduction
RNA sequencing has contributed much in the process of unraveling the factors involved in E. coli O157:H7 virulence and adherence by identifying genes that are actively transcribed in conditions of interest. In 2014, a large study involving multiple researchers was undertaken in Germany that studied the transcriptomes of E. coli O157:H7 in 11 different conditions related to study of pathogenesis (Landstorfer et al., 2014). E. coli O157:H7 was grown in media containing different pH ranges, nutrients, produce products, antibiotics, and cattle feces; and two separate RNAseq methods were compared. This study demonstrated the correlation between different RNAseq platforms (biological replicates in SOLiD and Illumina had a correlation of R=0.72); and also the validity of next generation sequencing (NGS) methods to identify transcripts of interest regarding gene/protein expression (Landstorfer et al., 2014). The results gave direct evidence for phenomena directly observed in pathogenesis in vivo. For example, it is been well documented that antibiotic treatment may be harmful in EHEC infection and may lead to a higher risk of patients developing HUS as a complication (Kimmitt et al., 2000). RNAseq allowed for the comparison of transcriptomes in response to different media containing antibiotics (especially trimethoprim combined with sulfamethoxazole) and demonstrated the induction of Shiga toxin expression, clearly elucidating at least one mechanism by which antibiotic treatment can cause more harm than in other enteric infections. The RNAseq can also be a useful technique to study the global effects of changes in single genes, such as the roles of complex regulators on virulence. A study out of the University of South Florida in 2015 investigated the global effects of a deletion mutation of grvA in E. coli O157:H7, which encodes the DNA-binding regulatory protein GrvA playing a major role in the regulation of the Gad AR system and the LEE operon (Morgan et al., 2015). The ΔgrvA strain affected the expression of over 700 genes, and led to interesting new information regarding the role of gad genes and acid resistance on the temporal regulation of LEE genes and how the GrvA regulator improves virulence by repressing AR at the same time it is activating LEE effectors (Morgan et al., 2015). Many similar studies have shed light on the interplay of these complex regulatory systems and effects on virulence and adherence gene expression.
Using similar methods, we generated a set of RNAseq data specific to E. coli O157:H7 initial adherence to the human colonic cell line Caco-2. The transcriptomes obtained allowed for selection and study of genes potentially involved in initial adherence using deletion mutations.
Summary of Results
In this study, we used data obtained through RNAseq to identify potential genes of interest in initial adherence of E. coli O157:H7 to Caco-2 cells in vitro. Out of the 5,579 genes identified through annotation, 1,521 were significantly differentially expressed in response to Caco-2 cell attachment (FC ≤ -2 or ≥ 2). Of those genes, 689 were upregulated. Among those, genes were selected based on subcellular location or other traits, and we attempted to make those deletions and characterize the resulting mutant strains. Here, we present the results of three gene deletions on the ability of these strains to form initial attachments to Caco-2 cells. The genes chuA, fhuE, and ompC were successfully deleted from E. coli O157:H7 and demonstrated significant defects in quantitative adherence experiments. We show that RNAseq is a validated useful technique for exploring possible unknown adhesins or adherence factors in E. coli O157:H7, and that the three genes examined may have either a direct or indirect role in initial adherence to human IECs in vitro.
4.2. Results
Figure 4.2 shows two columns of global gene expression in E. coli O157:H7 during initial adherence and in EMEM media, respectively. There are a considerable proportion of genes that show upregulation in EMEM media alone, as shown in rows colored yellow, orange, or red. All of these genes shown were excluded from analysis, as the differential expression was not due to adherence, but only the cell culture medium used. This figure is representative of the genes listed in Table 5.1; which describes the name, FC, location, and basic function of each upregulated gene from this analysis. A total of 5,579 genes were listed, with 3,451 genes (61.9%) identified by name during annotation, and 2,128 genes (38.1%) only listed with Qseq ID numbers, requiring manual identification using the NCBI database.
Figure 4.1. Heat Map of E. coli O157:H7 Gene Expression During Initial Adherence
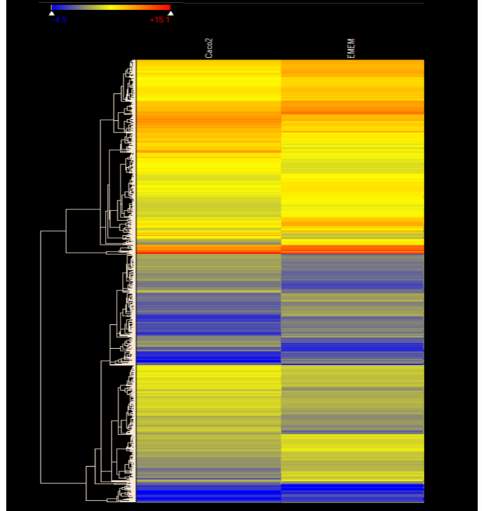
Figure 4.1. Heat map of E. coli O157:H7 gene expression during initial adherence. Figure 4.2 shows the global gene expression patterns of E. coli O157:H7 grown in media alone and while attached to Caco-2 cells during initial adherence.
The genes listed in Table 4.1 were selected from the list of differentially expressed genes in attached E. coli O157:H7 based on fold change in gene expression, subcellular location, or known roles in adherence. Also included are genes that are outside the scope of this study (initial adhesins) but are involved in adherence (such as fimbrial assembly genes) or virulence and may be of interest for future study. Genes that were significantly upregulated in EMEM media alone and those that could not be identified through annotation were excluded. These genes of interest were identified through annotation using the NCBI database using the reference sequences for E. coli O157:H7 EDL 933 and pO157 listed in Chapter 2.
Table 4.1. Genes Upregulated in E. coli O157:H7 Adhered to Caco-2 Cells
| Name | FC | Location | Type | Function | |
| afuA | 8.778 | Periplasmic | ABC Transporter | Ferric transporter protein | |
| Δ | chuA | 4.273 | OMP | Heme receptor | Heme receptor/utilization/transport protein |
| cirA | 2.729 | OMP | Siderophore/ ferritin | catecholate siderophore receptor; colicin IA receptor and translocator; ferric iron-catecholate transporter | |
| Δ | fhuE | 4.329 | OMP | Iron receptor/ transporter | Ferric-rhodotorulic receptor/ transporter |
| fimI | 6.665 | OMP | Fimbrial | Fimbrial structural protein; involved in type 1 pilus biosynthesis | |
| fliJ | 3.622 | Flagella | FliJ flagellar biosynthesis chaperone | ||
| lamB (malB) | 38.787 | OMP | Porin | Maltose porin (maltoporin) | |
| malF | 29.045 | OMP | Permease | Maltose permease/ABC transporter subunit | |
| Δ | ompC | 2.13 | OMP | Outer membrane protein C | |
| ppdD | 5.915 | OMP | Pilin | putative major pilin subunit | |
| sfa | 5.681 | OMP | Unknown | Cold shock gene | |
| Δ | slp | 3.464 | OMP | Unknown | Outer membrane lipoprotein involved in membrane stability during stationary phase and carbon starvation. |
| ybgD | 3.731 | OMP | Fimbrial | Uncharacterized fimbrial structural protein | |
| ycbR | 5.854 | Periplasmic | Chaperone | fimbrial chaperone protein elfD | |
| yebE | 3.69 | OMP | Unknown | Uncharacterized membrane protein YebE | |
| yecI | 3.501 | OMP | Ferritin | YecI ferritin MULTISPECIES: non-heme ferritin | |
| yfcS | 3.509 | Chaperone | YfcS fimbrial chaperone | ||
| ylcC | 3.612 | OMP | Copper receptor | YlcC copper-binding protein | |
| yqeK | 4.705 | OMP | Unknown | Hypothetical hyperosmolarity resistance protein Ebh | |
| yqjB | 4.338 | CM | Unknown | EnvZ/OmpR regulon moderator/membrane protein | |
| Z0024 | 14.682 | CM | Fimbrial | Uncharacterized fimbrial protein | |
| Z2200 | 5.51 | OMP | Fimbrial | Type-1 fimbrial protein, A chain precursor (Type-1A pilin) | |
| Z2201 (FimC) | 12.244 | Periplasmic | Fimbrial Chaperone | Fimbrial chaperone protein | |
| Z2203 | 3.533 | Usher | Z2203 fimbrial usher protein | ||
| Z2240 | 17.619 | OMP | Adhesin | IpaH-like protein | |
| Z2368 | 17.992 | CM | Unknown | Unknown hypothetical protein | |
| Z2619 (UidC) | 4.662 | OMP | Porin | Glucuronide uptake porin UidC | |
| Z2718 | 3.566 | OMP | Permease | Z2718 transport system permease | |
| Z3597 | 4.185 | OMP | Fimbrial | Uncharacterized loc10 fimbrial protein |
Δ – genes deleted in E. coli O157:H7
Table 4.1. Genes upregulated in E. coli O157:H7 adhered to Caco-2 cells. Table 4.1 lists genes of interest in initial adherence.
In Figure 4.2, the results of quantitative adherence and growth curve data are shown. The WT strain shows a steady and somewhat linear increase in the number of adhered cells over time, which was expected based on previous data. All three deletion mutant strains had varying degrees of statistically significant effects on initial adherence to Caco-2 cells. The ΔfhuE showed the largest adherence deficiency, while ΔchuA and ΔompC fared slightly better than what????. Both the ΔchuA and the ΔompC can be seen to slowly increase over time, reaching adherence of 30% and 40% of the WT, respectively at three hours post-infection. The ΔompC recovers its ability to adhere more quickly than ΔchuA does, and more than ΔfhuE does. Interestingly, ΔfhuE does not seem to recover its ability to attach to Caco-2 cells even after 3 hours (never reaching adherence above 5% of the wild-type). Neither ΔchuA nor ΔfhuE demonstrated any detectable growth defects, but ΔompC showed slightly decreased growth during mid to late exponential and early stationary phase (shown in Figure 4.2). The ΔchuA, ΔfhuE, and Δslp had growth values within 5% of the wild-type at all time points, but ΔompC grew to 75-80% of WT optical density, beginning after approximately six hours in culture.
Figure 4.2. Quantitative Adherence and Growth Curves of E. coli O157:H7 Strains
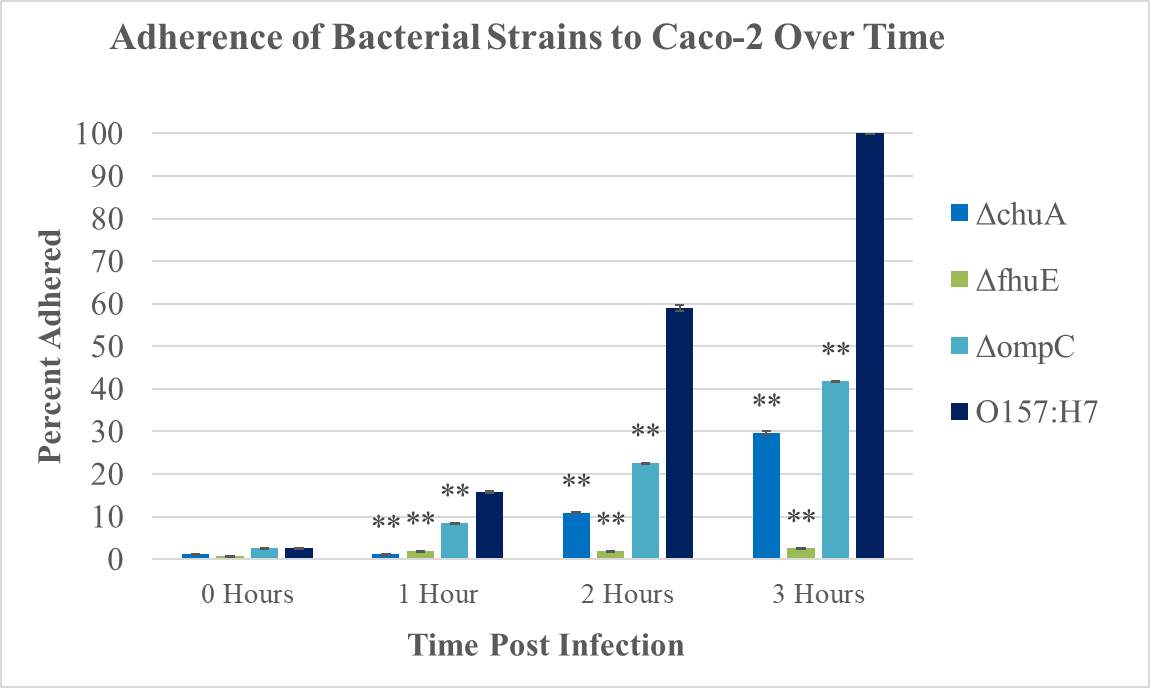
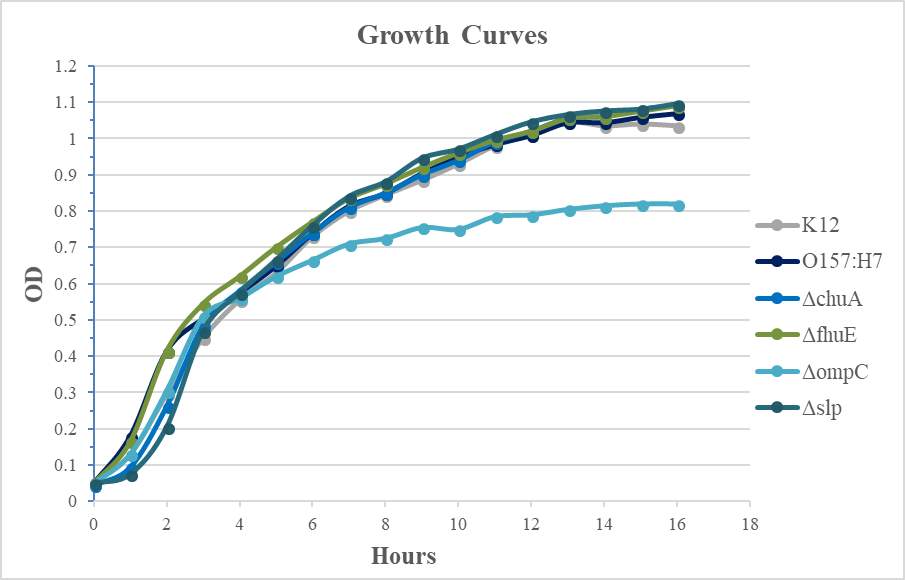
Figure 4.2. Quantitative adherence and growth curves of E. coli O157:H7 strains. Figure 4.3 shows the adherence of E. coli O157:H7 and its deletion mutant strains ΔchuA, ΔfhuE, and ΔompC to Caco-2 cells from 0 to 3 hours, as compared to total wild-type adherence at three hours post-infection. Also shown are the growth curves measured using optical density (OD).
4.3. Discussion
Transcriptome of Initial Adherence
The samples used for this RNAseq analysis were infected as previously described and collected at two hours post-infection. This timepoint was chosen because it falls inside the timeline for initial adherence as established by previous studies and eae expression, and because it provides a reasonable sample size to work from while providing a view of gene expression in cells that have undergone adherence for ≤ 2 hours. Presumably, the median expression profile described in these results is approximately one hour, given the approximately linear rate at which wild-type cells appear to attach according to adherence shown in Figure 4.2. In this study, we aimed to uncover potential genes of interest in initial adherence of E. coli O157:H7. Overall, the majority of the genes upregulated involve metabolic function, which is to be expected for E. coli growing in rich media. The data shown in Table 4.1 represent genes that have been upregulated (with a fold change ≥ 2), identified through annotation, are located in the outer membrane (OMPs), or are known adherence or virulence related genes. The process of uncovering potential adherence-related genes is based on the presumption that an adhesin would show upregulation during the time course of initial attachment, which is supported by the presence of multiple fimbrial genes in Table 4.1. Some of the genes included are part of the usher-chaperone pathways, with some variability in detail. Usher chaperone pathways encode the chaperone protein to facilitate correct periplasmic protein folding, the usher protein to act as the assembly base/platform, and then the fimbrial structural subunits (usually denoted as the ‘major fimbrial subunit’) (Rendón et al., 2007). Fimbrial genes that encode proteins other than the outer membrane components are listed in the table as genes of interest. Also shown in Table 4.1 are several putative adhesins or virulence factors, iron receptors, and several nutrient receptors. The other types of genes described are mainly involved in the uptake of nutrients or other molecules required for viability, such as iron. The upregulation of these genes in response to adherence is not necessarily surprising, if the iron availability in the cell culture media supernatant is reduced quickly enough to induce expression of iron-uptake genes. The exact concentration and bioavailability of iron in these experimental conditions was not been measured, so this contribution to iron-uptake-gene upregulation is unknown. Overall, a concise summary of these factors on the observation of gene expression during adherence is not possible without much more intensive study of each of these genes individually. However, we were able to successfully delete three of the genes listed and examined the effects of the deletion mutation on adherence in vitro. ChuA is a 69-kDa protein encoded in the heme transport locus, located on the OI140 within the AFI in E. coli O157:H7 (Carter, Louie, et al., 2012). This gene is homologous to the shuA in Shigella dysenteriae, which is part of a heme transport and utilization operon, and shuA/chuA encode outer membrane heme receptors (Torres & Payne, 1997). FhuE is a 76 kDa outer membrane protein that functions as a receptor for ferric coprogen and ferric-rhodotorulic acid (Sauer, Hantke, & Braun, 1987). OmpC is an osmoporin protein in the outer membrane (Baslé, Rummel, Storici, Rosenbusch, & Schirmer, 2006). As shown in Figure 4.2, all deletion mutants showed some level of adherence deficiency to Caco-2 cells over three hours. The most severe deficiency was in ΔfhuE, which never achieved more than 5% of the wild-type levels of adherence. ΔchuA and ΔompC recovered 30% and 40% by three hours, respectively. Both the ΔchuA and ΔompC follow the expected pattern for an initial adherence interruption, which is to see a gradual increase in the number of cells adhered over time. The rates at which the number of adhered cells increases is lower than that in wild-type, but still follows the same pattern (though this phenotype shows nothing conclusive on its own). The mechanisms and regulation involved in heme uptake and utilization are very complex and require intensive study to be able to make any definitive conclusions regarding possible roles in adherence. In this case, the conclusion can only be taken as far as noting that deletion of the chuA and ompC genes cause an early adherence deficiency to Caco-2 cells in vitro. The ΔfhuE was not able to attach to any significant degree at any time point measured. This near-complete elimination of adherence indicates that the deletion of fhuE interrupts one or more processes vital to the cell in these conditions. It’s unclear whether this is due to any direct involvement in adherence, as this could also point towards an overall disruption of a mechanism required for viability. This seems a somewhat unlikely explanation, due to a completely normal growth curve, but the adherence assay and the growth curve were not done using the same media and therefore could have masked a defect causing this phenotype. It is also interesting to note that, while ΔompC showed a modest growth deficiency, it was the least affected during adherence. The implications of these data are unclear and further study is needed to understand the mechanisms behind the adherence and growth phenotypes of these deletion mutant strains.
Chapter 5: Summary and Future Directions
5.1. Summary and Future Work
E. coli O157:H7 is currently a significant diarrheal pathogen, causing multiple outbreaks every year, with few effective treatments or interventions available. Initial adherence mechanisms are highly relevant to E. coli O157:H7’s ability to colonize the human host and cause disease and may present an opportunity for future interventions or treatments. OMPs expressed during the early stages of infection are ideal targets for vaccines, as it is much more effective to intervene at that time before more difficult virulence factors have been engaged. In this study, we aimed to identify bacterial proteins involved in initial adherence to IECs.
To this end, we quantified and characterized an interesting phenotype of E. coli O157:H7 and other EHEC: the significant colocalization of bacterial cells with pIgR expressed on the surface of Caco-2 cells. The colocalization observed was consistent with the expected pattern of adherence during initial adherence, which is an initial peak of colocalization at the earliest time points followed by a gradual decrease over time as intimate adherence mechanisms take over adherence function. The observations of colocalization between E. coli O157:H7 and other pathogenic E. coli strains were shown to have a significant correlation of location with the pIgR, which was not seen in the nonpathogenic E. coli K12, which was evidence of the role in initial adherence. Three additional pathogenic E. coli strains were tested for colocalization in a preliminary manner, and showed the same highly correlated phenotype seen with E. coli O157:H7. As these strains varied in the presence of several notable virulence genes, the strong colocalization phenotype implies that this adherence phenomenon likely extends to other types of pathogenic E. coli. Future study regarding the extent of this shared adherence mechanism among pathogenic E. coli strains could provide insight into adherence and virulence mechanisms.
The observations of pigr gene expression in Caco-2 cells seem to correlate very well with the initial adherence timeline, but the mechanism responsible for linking these two processes is unknown. E. coli O157:H7 has many mechanisms by which it can affect pigr regulation and expression, but as of yet there are no defined factors known to be taking effect before intimate adherence is established. Investigation of how initial adherence affects expression of pigr has implications beyond E. coli O157:H7 pathogenesis, as this would likely be a phenomenon shared with other pathogens and also may extend further into immune response regulation.
To identify the bacterial factors involved in the relationship with pIgR protein, we used a direct Co-IP assay and identified the protein interacting with pIgR-Fc; the bacterial protein Slp. After we demonstrated the identity of the pIgR adhesin as the bacterial protein Slp, many questions arose regarding its function and regulation. One of the foremost questions would be to understand how this binding is taking place. In S.pneumoniae, the adhesin that allows it to adhere to pIgR is also able to bind to free secretary component (fSC) (Hammerschmidt et al., 2002), and it would follow to complete similar work regarding the binding mechanisms and limitations of this interaction in E. coli. Slp is part of an interesting set of virulence and stress response genes, and these mechanisms have only begun to be unraveled. Its main function has been described as membrane stability during carbon starvation stress response and entry into stationary phase, but it is encoded as part of an acid fitness island and is associated with the most potent acid resistance system possessed by E. coli O157:H7 (Gad). As slp in encoded in a small operon with another gene, yhiF, it would be interesting to observe the effects of a deletion of this entire operon and compare phenotypes with the Δslp single knockout strain used in this study. One research group did make this deletion in E. coli K12, and observed it to have significant defects in viability when exposed to some types of toxic organic metabolites, though single mutations in either gene did not show this same effect (Mates et al., 2007). This work provides evidence that Slp and YhiF have at least one redundant function, yet the adherence data shown here does not seem to imply that there was much compensation for the Δslp-induced adherence deficiency. A study of the shared and distinct functions of these proteins would be compelling.
Regarding genes identified through RNA sequencing, the opportunity for future work is plentiful. Studies into many different genes or operons described in chapter 5 could produce significant results related to adherence or virulence. Work specific to the three genes studied (chuA, fhuE, and ompC) has been cut out with the preliminary results shown here. Data of the effects of these mutations on adherence is definitive; however, the cause of the adherence phenotypes is unknown. Certainly, all three deletion induced adherence deficiencies arrive from three distinct mechanisms, and further study is needed to understand how this occurs. An important first step would be to construct complementations of each gene and observe the effects of gene replacement (or possibly over-expression, as seen here) on adherence. Furthermore, detailed mechanistic studies would be required to clarify direct vs indirect roles in adherence for each gene and gene product.
The burden of E. coli O157:H7 and other pathogenic E. coli is an ongoing public health problem all around the world. As the subject of scientific study, it is a fascinating and impressively complex and virulent organism; as the cause of serious illness and death, it is a compelling target for any intervention that might reduce its prevalence. Opportunities for intervention lie mainly in two areas- transmission from its natural reservoir, and prevention of human infection after exposure. Initial attachment mechanisms play a vitally important role in both areas, and are not yet well understood. The description of an initial adherence mechanism could lead to important work towards development of the most ideal intervention strategy (vaccine), but also may contribute towards other achievements in the challenge this organism presents.
Appendix
Appendix A. Additional Materials and Methods
Appendix B. Colocalization and Statistics
Colocalization Statistics
In order to interpret the correlations shown, it is important to note what the correlation coefficients are actually measuring. Pearson’s correlation coefficient (hereafter referred to as the R value) is a measure of the relationship between two variables, in this case the linear relationship in a regression analysis of a scatterplot of fluorescent signals. Essentially, the probability of finding a red and green pixel together at any given point in a composite image (pixel covariance) (Kopan et al., 2011). More precisely, it calculates this probability in such a way as to greatly reduce the risk of false positive results if the input data is of reasonable quality. R is calculated for positive fluorescent signals in each channel, subtracting background noise by subtracting the mean fluorescence intensity of each channel. A positive signal is any pixel that has an intensity above the threshold set by the mean fluorescence intensity.
The R value equation used here has an internal component that subtracts background noise, by defining the average fluorescence intensity of all pixels as the threshold for identification of a positive signal in a pixel:
(Pearson’s Correlation Coefficient/PCC) R = ∑i(Ri−R¯)×(Gi−G¯)∑i(Ri−R¯)2×∑i(Gi−G¯)2; where Ri and Gi are the intensity values of pixels in the red and green channels, respectively; and R̄ and Ḡ are the mean fluorescence intensities, respectively (Kopan et al., 2011).
This method does lose some accuracy as background noise increases, but still maintains reasonable accuracy even in high-background-noise data sets. However, the fluorescence images we obtained have low background and clearly differentiated pixels, and the interference of background noise is low and unlikely to have interfered with analysis, especially after the application of R2. Even so, any background signal would be the same across all samples (samples use the same host cells, conditions, antibodies and reagents, preparation process, and microscope) and would not have any significant impact on the comparison of ratios across data sets. R values can be further interpreted using the R-squared value (R2) (coefficient of determination), which tells the proportion of covariance that can be explained by random chance (Bolte & Cordelières, 2006) (Kopan et al., 2011). Because R values measure the proportional, linear relationship between covariance of red and green pixels overall, they give very good indication of correlative relationships but can sometimes miss subtle nuances of skewed data sets. R is the probability of finding red and green pixels together at any given point- it does not show any disproportionate pattern between R/G (red overlapping green) vs G/R (green overlapping red). In perfectly proportioned colocalization, the fluorescence intensity and surface area the number of positive pixels in each channel would be identical. However, in this case, the comparison was between bacteria (single cells being ~1 micron, and multiplying cells with larger colonies) and protein (several magnitudes smaller). Given the disproportionate sizes, it stands to reason that the number of overlapping pixels in each channel would not be equal, even if the relationship in each colocalization point was 100% positively correlated.
Appendix C. List of 686 genes upregulated in E. coli O157:H7 during adherence to Caco-2 cells.
| # | Name | FC | # | Name | FC | # | Name | FC | # | Name | FC | |||||||
| 1 | aceA | 21.85 | 51 | cyoD | 2.40 | 101 | hcaR | 8.06 | 151 | mhpR | 3.30 | |||||||
| 2 | aceB | 17.76 | 52 | cyoE | 2.28 | 102 | hisC | 2.28 | 152 | miaA | 2.01 | |||||||
| 3 | aceK | 10.04 | 53 | cysP | 2.94 | 103 | hisD | 2.52 | 153 | moaA | 2.31 | |||||||
| 4 | acnB | 3.38 | 54 | dadA | 2.43 | 104 | hisG | 2.61 | 154 | molR_B | 2.15 | |||||||
| 5 | acrR | 2.15 | 55 | dadX | 3.42 | 105 | hisL | 2.84 | 155 | mtgA | 2.34 | |||||||
| 6 | acs | 15.91 | 56 | dctA | 5.66 | 106 | holE | 2.77 | 156 | nanT | 2.32 | |||||||
| 7 | afuA | 8.78 | 57 | dniR | 2.58 | 107 | hscA | 3.45 | 157 | napD | 8.60 | |||||||
| 8 | afuB | 6.27 | 58 | dppA | 2.44 | 108 | htpX | 2.11 | 158 | nrfC | 2.82 | |||||||
| 9 | afuC | 4.19 | 59 | dppB | 2.80 | 109 | hybF | 2.36 | 159 | nth | 2.26 | |||||||
| 10 | agaC | 6.63 | 60 | ecpD | 2.51 | 110 | hybG | 2.71 | 160 | nuoG | 2.20 | |||||||
| 11 | agaI_2 | 3.74 | 61 | emrK | 2.05 | 111 | hyfA | 3.39 | 161 | nuoH | 2.75 | |||||||
| 12 | agaV | 3.42 | 62 | envR | 2.02 | 112 | hyfD | 2.07 | 162 | nuoI | 2.63 | |||||||
| 13 | ais | 4.46 | 63 | envY | 2.54 | 113 | hyfF | 2.06 | 163 | nuoJ | 2.32 | |||||||
| 14 | alaX | 3.05 | 64 | escR | 4.13 | 114 | iclR | 5.84 | 164 | nuoK | 2.30 | |||||||
| 15 | aldA | 2.32 | 65 | eutE | 2.19 | 115 | ileZ | 4.63 | 165 | ordL | 7.42 | |||||||
| 16 | aldH | 11.57 | 66 | eutG | 2.21 | 116 | ilvB | 9.74 | 166 | pckA | 2.25 | |||||||
| 17 | aphA | 2.12 | 67 | exuT | 2.32 | 117 | ilvG | 2.90 | 167 | pepB | 2.79 | |||||||
| 18 | appA | 2.72 | 68 | fadA | 3.14 | 118 | ilvM | 4.06 | 168 | pheU | 2.21 | |||||||
| 19 | appB | 2.09 | 69 | fadB | 6.44 | 119 | ilvN | 10.21 | 169 | pheV | 8.30 | |||||||
| 20 | arcC | 3.39 | 70 | fdoH | 2.16 | 120 | ivbL | 2.24 | 170 | phnC | 8.99 | |||||||
| 21 | argN | 6.43 | 71 | fdx | 3.45 | 121 | kefB | 2.02 | 171 | phnJ | 3.01 | |||||||
| 22 | argO | 4.04 | 72 | fimE | 3.30 | 122 | lamB | 38.79 | 172 | phnL | 2.26 | |||||||
| 23 | argT | 2.43 | 73 | fimI | 6.67 | 123 | lar | 4.37 | 173 | phnM | 2.37 | |||||||
| 24 | arp | 6.50 | 74 | fimZ | 2.66 | 124 | leuA | 2.20 | 174 | phoE | 2.80 | |||||||
| 25 | arsC | 4.88 | 75 | flgC | 2.48 | 125 | leuU | 2.00 | 175 | pinH | 2.61 | |||||||
| 26 | aslB | 2.43 | 76 | flgM | 2.90 | 126 | leuX | 3.08 | 176 | pitA | 2.07 | |||||||
| 27 | asnC | 2.60 | 77 | flgN | 2.39 | 127 | livJ | 2.63 | 177 | ppdD | 5.92 | |||||||
| 28 | bax | 2.22 | 78 | fliF | 2.71 | 128 | lldD | 5.08 | 178 | pphA | 2.17 | |||||||
| 29 | betA | 3.71 | 79 | fliJ | 3.62 | 129 | lldP | 9.41 | 179 | ppsA | 2.94 | |||||||
| 30 | betB | 4.61 | 80 | fliK | 2.02 | 130 | lldR | 6.80 | 180 | prfH | 2.23 | |||||||
| 31 | betI | 4.96 | 81 | fliL | 2.05 | 131 | lysA | 4.06 | 181 | proK | 2.79 | |||||||
| 32 | betT | 6.72 | 82 | fliR | 2.84 | 132 | lysZ | 2.13 | 182 | proV | 2.35 | |||||||
| 33 | bglJ | 3.66 | 83 | folK | 2.71 | 133 | malE | 22.08 | 183 | prpB | 2.25 | |||||||
| 34 | bioC | 3.69 | 84 | gatB | 8.93 | 134 | malF | 29.05 | 184 | prpC | 3.73 | |||||||
| 35 | carA | 2.74 | 85 | gatD | 2.37 | 135 | malG | 23.37 | 185 | prpR | 3.91 | |||||||
| 36 | carB | 2.65 | 86 | gatZ | 2.84 | 136 | malK | 78.76 | 186 | ptsO | 2.03 | |||||||
| 37 | cchA | 3.26 | 87 | glpD | 2.83 | 137 | malM | 24.08 | 187 | putA | 2.92 | |||||||
| 38 | chaA | 5.26 | 88 | glpE | 2.07 | 138 | malP | 6.13 | 188 | pyrB | 2.40 | |||||||
| 39 | citC | 2.05 | 89 | glpF | 5.66 | 139 | malQ | 4.59 | 189 | rbsC | 2.75 | |||||||
| 40 | cmtA | 2.89 | 90 | glpK | 5.92 | 140 | malS | 5.24 | 190 | rbsK | 2.08 | |||||||
| 41 | corA | 2.27 | 91 | glpQ | 2.26 | 141 | malZ | 2.66 | 191 | rfaH | 2.13 | |||||||
| 42 | crcA | 4.00 | 92 | glpT | 3.74 | 142 | metV | 2.42 | 192 | rhaB | 2.19 | |||||||
| 43 | cspA | 3.02 | 93 | glpX | 2.27 | 143 | metW | 3.37 | 193 | rhoL | 2.53 | |||||||
| 44 | cspG | 6.62 | 94 | gltA | 4.75 | 144 | metY | 8.87 | 194 | ribB | 4.07 | |||||||
| 45 | cspH | 13.65 | 95 | glyU | 2.15 | 145 | metZ | 2.74 | 195 | rpoH | 2.13 | |||||||
| 46 | cutC | 2.10 | 96 | glyY | 2.61 | 146 | mglA | 3.35 | 196 | rrfG | 2.03 | |||||||
| 47 | cyoA | 2.59 | 97 | gntT | 4.61 | 147 | mglB | 2.20 | 197 | rrfH | 2.12 | |||||||
| 48 | cyoB | 2.94 | 98 | goaG | 3.98 | 148 | mglC | 3.26 | 198 | rstA | 5.87 | |||||||
| 49 | cyoC | 2.99 | 99 | gutM | 8.38 | 149 | mgtA | 19.65 | 199 | rstB | 3.89 | |||||||
| 50 | ilvN | 10.21 | 100 | hcaC | 4.52 | 150 | mhpA | 7.99 | 200 | rtcR | 2.23 | |||||||
| # | Name | FC | # | Name | FC | # | Name | FC | # | Name | FC | |||||||
| 201 | sdaB | 2.78 | 251 | yahN | 2.02 | 301 | yegX | 5.59 | 351 | yjeB | 2.30 | |||||||
| 202 | sdaC | 2.80 | 252 | yaiV | 4.60 | 302 | yehI | 2.08 | 352 | yjfJ | 2.59 | |||||||
| 203 | sdhA | 8.45 | 253 | yajB | 2.28 | 303 | yehP | 2.35 | 353 | yjfK | 4.78 | |||||||
| 204 | sdhB | 8.30 | 254 | ybaA | 2.80 | 304 | yeiC | 3.53 | 354 | yjfL | 4.38 | |||||||
| 205 | sdhC | 10.08 | 255 | ybaJ | 3.52 | 305 | yeiK | 3.35 | 355 | yjfM | 2.07 | |||||||
| 206 | sdhD | 8.52 | 256 | ybbA | 2.26 | 306 | yeiL | 2.38 | 356 | yjfN | 2.39 | |||||||
| 207 | sfa | 5.68 | 257 | ybbD | 4.50 | 307 | yeiN | 2.86 | 357 | yjfZ | 2.09 | |||||||
| 208 | sfmD | 2.75 | 258 | ybbS | 2.40 | 308 | yeiQ | 2.35 | 358 | yjgG_1 | 36.27 | |||||||
| 209 | soxS | 4.21 | 259 | ybdF | 2.15 | 309 | yejF | 2.18 | 359 | yjgG_2 | 2.18 | |||||||
| 210 | spr | 2.17 | 260 | ybdJ | 2.00 | 310 | yejG | 5.74 | 360 | yjgI | 2.29 | |||||||
| 211 | srlA_1 | 2.94 | 261 | ybdS | 2.32 | 311 | yejL | 2.02 | 361 | yjiJ | 2.88 | |||||||
| 212 | sseB | 2.41 | 262 | ybdU | 2.53 | 312 | yfcS | 3.51 | 362 | yjjN | 2.17 | |||||||
| 213 | sucA | 4.37 | 263 | ybeW | 2.08 | 313 | yfdE | 11.15 | 363 | yjjP | 2.61 | |||||||
| 214 | sucB | 2.82 | 264 | ybfE | 2.24 | 314 | yfhE | 3.89 | 364 | yjjQ | 5.63 | |||||||
| 215 | sucC | 2.80 | 265 | ybfM | 2.77 | 315 | yfhF | 3.70 | 365 | ykgL | 9.65 | |||||||
| 216 | sucD | 2.53 | 266 | ybgD | 3.73 | 316 | yfhJ | 3.51 | 366 | ylaC | 2.22 | |||||||
| 217 | tdcC | 2.31 | 267 | ybiU | 3.26 | 317 | yfhL | 2.23 | 367 | ylaD | 3.74 | |||||||
| 218 | tdcD | 3.61 | 268 | ybiY | 2.16 | 318 | yfhO | 3.66 | 368 | ylcB | 3.43 | |||||||
| 219 | tdcE | 4.80 | 269 | ybjG | 3.74 | 319 | ygaE | 2.00 | 369 | ylcC | 3.61 | |||||||
| 220 | terW_2 | 2.32 | 270 | ybjO | 2.48 | 320 | ygbA | 5.51 | 370 | yliI | 2.63 | |||||||
| 221 | tesA | 2.13 | 271 | ybjX | 4.36 | 321 | ygeT | 2.04 | 371 | yodB | 4.15 | |||||||
| 222 | thiE | 2.18 | 272 | ycbK | 2.80 | 322 | ygfA | 2.12 | 372 | yphC_1 | 5.05 | |||||||
| 223 | thiM | 2.36 | 273 | ycbP | 3.19 | 323 | ygiB | 2.21 | 373 | yqcE | 2.36 | |||||||
| 224 | thiS | 4.07 | 274 | ycbR | 5.85 | 324 | ygiC | 2.07 | 374 | yqeF | 4.13 | |||||||
| 225 | tnaA | 6.21 | 275 | yccA | 2.93 | 325 | ygiD | 3.78 | 375 | yqeK | 4.71 | |||||||
| 226 | tnaB | 3.19 | 276 | yccM | 5.35 | 326 | ygiP | 4.21 | 376 | yqgD | 5.92 | |||||||
| 227 | tnaL | 7.33 | 277 | yceO | 13.14 | 327 | ygjI | 4.69 | 377 | yqhG | 2.72 | |||||||
| 228 | torD | 2.08 | 278 | ycfS | 10.50 | 328 | ygjJ | 3.88 | 378 | yqjA | 3.02 | |||||||
| 229 | treB | 3.02 | 279 | yciR | 2.44 | 329 | ygjL | 3.37 | 379 | yqjB | 4.34 | |||||||
| 230 | trg | 3.11 | 280 | ycjC | 8.77 | 330 | ygjT | 4.28 | 380 | yraH | 3.38 | |||||||
| 231 | ttdA | 2.68 | 281 | ycjJ | 5.06 | 331 | ygjV | 2.12 | 381 | yrbL | 5.42 | |||||||
| 232 | tus | 2.25 | 282 | ycjL | 17.24 | 332 | yhaB | 13.63 | 382 | yrfB | 2.40 | |||||||
| 233 | udhA | 2.56 | 283 | ycjO | 2.49 | 333 | yhaI | 4.42 | 383 | yrfD | 2.47 | |||||||
| 234 | ugpA | 2.39 | 284 | ycjP | 3.43 | 334 | yhaR | 4.09 | 384 | ytfF | 2.30 | |||||||
| 235 | ugpB | 3.87 | 285 | ycjZ | 2.23 | 335 | yhdJ | 2.08 | 385 | ytfK | 3.24 | |||||||
| 236 | ugpE | 2.94 | 286 | ydaJ | 4.25 | 336 | yhdU | 18.37 | 386 | Z_L7025 | 2.07 | |||||||
| 237 | uhpT | 11.08 | 287 | ydaQ | 3.74 | 337 | yheL | 2.23 | 387 | Z_L7054 | 2.61 | |||||||
| 238 | uidA_2 | 2.47 | 288 | ydeH | 4.46 | 338 | yheR | 2.60 | 388 | Z_L7055 | 5.71 | |||||||
| 239 | uidB | 3.34 | 289 | ydeW | 2.10 | 339 | yiaG | 4.20 | 389 | Z_L7079 | 2.02 | |||||||
| 240 | uxaB | 2.23 | 290 | ydeY | 3.91 | 340 | yiaI | 4.05 | 390 | Z_L7083 | 3.57 | |||||||
| 241 | valV | 2.47 | 291 | ydeZ | 2.59 | 341 | yigI | 2.13 | 391 | Z0023 | 2.26 | |||||||
| 242 | valW | 2.84 | 292 | ydiD | 2.78 | 342 | yihE | 2.61 | 392 | Z0024 | 14.68 | |||||||
| 243 | xylR | 2.19 | 293 | yeaV | 2.49 | 343 | yihF | 2.72 | 393 | Z0039 | 4.65 | |||||||
| 244 | yaaI | 9.64 | 294 | yebA | 2.50 | 344 | yiiO | 13.49 | 394 | Z0057 | 2.03 | |||||||
| 245 | yacC | 2.78 | 295 | yebE | 3.69 | 345 | yjaE | 2.50 | 395 | Z0065 | 2.31 | |||||||
| 246 | yaeG | 2.99 | 296 | yebL | 2.68 | 346 | yjbI | 7.29 | 396 | Z0115 | 2.35 | |||||||
| 247 | yafH | 2.91 | 297 | yecI | 3.50 | 347 | yjcC | 2.26 | 397 | Z0246 | 8.18 | |||||||
| 248 | yagT | 2.08 | 298 | yecK | 2.33 | 348 | yjcG | 4.76 | 398 | Z0265 | 13.20 | |||||||
| 249 | yahE | 3.64 | 299 | yedA | 2.24 | 349 | yjcH | 14.18 | 399 | Z0308 | 3.12 | |||||||
| 250 | yahI | 2.35 | 300 | yedE | 2.08 | 350 | yjdB | 2.03 | 400 | Z0330 | 2.77 | |||||||
| # | Name | FC | # | Name | FC | # | Name | FC | # | Name | FC | |||||||
| 401 | Z0343 | 2.06 | 451 | Z1329 | 2.46 | 501 | Z2078 | 2.02 | 551 | Z2619 | 4.66 | |||||||
| 402 | Z0345 | 3.47 | 452 | Z1330 | 4.53 | 502 | Z2081 | 4.18 | 552 | Z2658 | 2.30 | |||||||
| 403 | Z0366 | 2.18 | 453 | Z1331 | 25.51 | 503 | Z2084 | 2.50 | 553 | Z2698 | 2.72 | |||||||
| 404 | Z0369 | 4.22 | 454 | Z1352 | 2.13 | 504 | Z2085 | 2.84 | 554 | Z2702 | 3.08 | |||||||
| 405 | Z0392 | 2.81 | 455 | Z1374 | 2.66 | 505 | Z2098 | 2.08 | 555 | Z2717 | 3.02 | |||||||
| 406 | Z0397 | 5.96 | 456 | Z1387 | 2.06 | 506 | Z2113 | 2.15 | 556 | Z2718 | 3.57 | |||||||
| 407 | Z0422 | 13.33 | 457 | Z1434 | 2.34 | 507 | Z2119 | 4.54 | 557 | Z2760 | 2.21 | |||||||
| 408 | Z0443 | 2.49 | 458 | Z1449 | 2.46 | 508 | Z2120 | 2.65 | 558 | Z2779 | 2.07 | |||||||
| 409 | Z0461 | 18.40 | 459 | Z1454 | 2.08 | 509 | Z2124 | 2.72 | 559 | Z2800 | 2.43 | |||||||
| 410 | Z0462 | 3.13 | 460 | Z1457 | 2.32 | 510 | Z2164 | 4.22 | 560 | Z2813 | 2.53 | |||||||
| 411 | Z0502 | 2.54 | 461 | Z1503 | 3.05 | 511 | Z2175 | 5.37 | 561 | Z2864 | 2.59 | |||||||
| 412 | Z0608 | 2.44 | 462 | Z1539 | 3.95 | 512 | Z2176 | 8.36 | 562 | Z2872 | 12.70 | |||||||
| 413 | Z0655 | 3.49 | 463 | Z1541 | 2.74 | 513 | Z2200 | 5.55 | 563 | Z2883 | 2.37 | |||||||
| 414 | Z0665 | 2.21 | 464 | Z1557 | 2.26 | 514 | Z2201 | 12.24 | 564 | Z2893 | 3.45 | |||||||
| 415 | Z0667 | 2.55 | 465 | Z1561 | 2.17 | 515 | Z2203 | 3.53 | 565 | Z2894 | 2.27 | |||||||
| 416 | Z0706 | 2.18 | 466 | Z1574 | 2.08 | 516 | Z2204 | 2.26 | 566 | Z2958 | 4.00 | |||||||
| 417 | Z0753 | 2.55 | 467 | Z1595 | 2.51 | 517 | Z2221 | 2.37 | 567 | Z2974 | 2.26 | |||||||
| 418 | Z0828 | 2.59 | 468 | Z1597 | 2.19 | 518 | Z2222 | 2.98 | 568 | Z2975 | 2.92 | |||||||
| 419 | Z0851 | 2.30 | 469 | Z1608 | 2.48 | 519 | Z2224 | 2.47 | 569 | Z2976 | 20.58 | |||||||
| 420 | Z0855 | 5.93 | 470 | Z1609 | 2.93 | 520 | Z2225 | 2.15 | 570 | Z2978 | 2.28 | |||||||
| 421 | Z0856 | 5.03 | 471 | Z1619 | 2.98 | 521 | Z2229 | 32.57 | 571 | Z3024 | 6.76 | |||||||
| 422 | Z0879 | 6.94 | 472 | Z1621 | 3.99 | 522 | Z2240 | 17.62 | 572 | Z3101 | 2.10 | |||||||
| 423 | Z0884 | 8.54 | 473 | Z1623 | 3.73 | 523 | Z2254 | 3.42 | 573 | Z3108 | 2.54 | |||||||
| 424 | Z0885 | 6.79 | 474 | Z1624 | 17.30 | 524 | Z2263 | 3.50 | 574 | Z3110 | 2.90 | |||||||
| 425 | Z0888 | 2.31 | 475 | Z1625 | 2.09 | 525 | Z2274 | 2.12 | 575 | Z3112 | 2.98 | |||||||
| 426 | Z0890 | 11.56 | 476 | Z1628 | 2.35 | 526 | Z2283 | 4.26 | 576 | Z3127 | 2.82 | |||||||
| 427 | Z0894 | 4.34 | 477 | Z1631 | 3.26 | 527 | Z2293 | 3.50 | 577 | Z3154 | 2.02 | |||||||
| 428 | Z0895 | 4.06 | 478 | Z1693 | 5.97 | 528 | Z2296 | 2.51 | 578 | Z3155 | 3.45 | |||||||
| 429 | Z0897 | 3.35 | 479 | Z1788 | 2.49 | 529 | Z2298 | 11.71 | 579 | Z3235 | 4.01 | |||||||
| 430 | Z0947 | 3.35 | 480 | Z1808 | 2.10 | 530 | Z2299 | 3.74 | 580 | Z3241 | 2.81 | |||||||
| 431 | Z0951 | 2.54 | 481 | Z1867 | 5.09 | 531 | Z2311 | 5.92 | 581 | Z3270 | 4.71 | |||||||
| 432 | Z0952 | 2.66 | 482 | Z1869 | 3.19 | 532 | Z2318 | 6.38 | 582 | Z3340 | 2.18 | |||||||
| 433 | Z0954 | 2.26 | 483 | Z1876 | 3.72 | 533 | Z2319 | 13.01 | 583 | Z3393 | 2.18 | |||||||
| 434 | Z0957 | 2.67 | 484 | Z1877 | 2.32 | 534 | Z2343 | 2.26 | 584 | Z3395 | 2.10 | |||||||
| 435 | Z0960 | 2.09 | 485 | Z1884 | 3.26 | 535 | Z2359 | 3.26 | 585 | Z3433 | 3.87 | |||||||
| 436 | Z0961 | 3.24 | 486 | Z1922 | 2.56 | 536 | Z2363 | 2.05 | 586 | Z3504 | 2.90 | |||||||
| 437 | Z1019 | 2.76 | 487 | Z1923 | 4.25 | 537 | Z2368 | 17.99 | 587 | Z3505 | 2.60 | |||||||
| 438 | Z1038 | 2.71 | 488 | Z1924 | 2.98 | 538 | Z2369 | 2.45 | 588 | Z3506 | 9.59 | |||||||
| 439 | Z1098 | 3.02 | 489 | Z1927 | 2.69 | 539 | Z2385 | 2.30 | 589 | Z3517 | 2.41 | |||||||
| 440 | Z1130 | 2.06 | 490 | Z1965 | 2.07 | 540 | Z2402 | 3.26 | 590 | Z3518 | 6.99 | |||||||
| 441 | Z1157 | 2.58 | 491 | Z1989 | 2.44 | 541 | Z2427 | 2.24 | 591 | Z3596 | 2.59 | |||||||
| 442 | Z1169 | 2.35 | 492 | Z2038 | 4.57 | 542 | Z2473 | 2.96 | 592 | Z3597 | 4.19 | |||||||
| 443 | Z1170 | 2.63 | 493 | Z2051 | 2.15 | 543 | Z2491 | 18.62 | 593 | Z3605 | 2.75 | |||||||
| 444 | Z1185 | 2.88 | 494 | Z2052 | 4.13 | 544 | Z2507 | 7.53 | 594 | Z3609 | 2.31 | |||||||
| 445 | Z1186 | 2.25 | 495 | Z2056 | 4.60 | 545 | Z2509 | 2.50 | 595 | Z3615 | 2.02 | |||||||
| 446 | Z1188 | 14.92 | 496 | Z2059 | 2.12 | 546 | Z2561 | 29.44 | 596 | Z3616 | 2.59 | |||||||
| 447 | Z1189 | 12.92 | 497 | Z2062 | 2.05 | 547 | Z2562 | 2.32 | 597 | Z3617 | 4.97 | |||||||
| 448 | Z1193 | 2.15 | 498 | Z2071 | 3.39 | 548 | Z2593 | 3.39 | 598 | Z3618 | 2.31 | |||||||
| 449 | Z1292 | 2.47 | 499 | Z2072 | 2.01 | 549 | Z2594 | 3.83 | 599 | Z3621 | 2.44 | |||||||
| 450 | Z1327 | 25.56 | 500 | Z2076 | 15.25 | 550 | Z2595 | 3.12 | 600 | Z3624 | 2.55 | |||||||
| # | Name | FC | # | Name | FC | |||||||||||||
| 601 | Z3637 | 2.28 | 651 | Z5027 | 3.40 | |||||||||||||
| 602 | Z3715 | 6.18 | 652 | Z5095 | 2.49 | |||||||||||||
| 603 | Z3750 | 2.07 | 653 | Z5096 | 2.62 | |||||||||||||
| 604 | Z3768 | 4.40 | 654 | Z5097 | 2.72 | |||||||||||||
| 605 | Z3796 | 3.06 | 655 | Z5137 | 2.23 | |||||||||||||
| 606 | Z3798 | 3.74 | 656 | Z5140 | 2.37 | |||||||||||||
| 607 | Z3802 | 2.52 | 657 | Z5154 | 2.35 | |||||||||||||
| 608 | Z3849 | 2.95 | 658 | Z5160 | 2.72 | |||||||||||||
| 609 | Z3931 | 2.55 | 659 | Z5162 | 4.74 | |||||||||||||
| 610 | Z3934 | 2.92 | 660 | Z5163 | 6.76 | |||||||||||||
| 611 | Z3935 | 4.28 | 661 | Z5224 | 3.20 | |||||||||||||
| 612 | Z3954 | 10.66 | 662 | Z5334 | 26.86 | |||||||||||||
| 613 | Z3966 | 4.61 | 663 | Z5335 | 2.59 | |||||||||||||
| 614 | Z4042 | 4.45 | 664 | Z5428 | 2.28 | |||||||||||||
| 615 | Z4045 | 6.36 | 665 | Z5444 | 3.01 | |||||||||||||
| 616 | Z4047 | 3.24 | 666 | Z5488 | 2.05 | |||||||||||||
| 617 | Z4079 | 2.41 | 667 | Z5489 | 2.46 | |||||||||||||
| 618 | Z4083 | 2.21 | 668 | Z5490 | 2.49 | |||||||||||||
| 619 | Z4170 | 11.20 | 669 | Z5491 | 3.58 | |||||||||||||
| 620 | Z4176 | 2.35 | 670 | Z5547 | 2.79 | |||||||||||||
| 621 | Z4184 | 11.50 | 671 | Z5814 | 4.37 | |||||||||||||
| 622 | Z4196 | 2.49 | 672 | Z5815 | 2.38 | |||||||||||||
| 623 | Z4218 | 2.12 | 673 | Z5852 | 18.54 | |||||||||||||
| 624 | Z4219 | 2.21 | 674 | Z5885 | 2.38 | |||||||||||||
| 625 | Z4220 | 2.22 | 675 | Z5893 | 4.23 | |||||||||||||
| 626 | Z4250 | 16.57 | 676 | Z5945 | 3.00 | |||||||||||||
| 627 | Z4271 | 2.14 | 677 | Z6017 | 2.42 | |||||||||||||
| 628 | Z4282 | 2.70 | 678 | Z6022 | 2.74 | |||||||||||||
| 629 | Z4322 | 4.15 | 679 | Z6024 | 2.53 | |||||||||||||
| 630 | Z4336 | 2.38 | 680 | Z6048 | 2.19 | |||||||||||||
| 631 | Z4402 | 2.11 | 681 | Z6057 | 2.71 | |||||||||||||
| 632 | Z4403 | 2.12 | 682 | Z6058 | 3.37 | |||||||||||||
| 633 | Z4464 | 7.28 | 683 | Z6071 | 2.29 | |||||||||||||
| 634 | Z4486 | 6.41 | 684 | Z6076 | 2.21 | |||||||||||||
| 635 | Z4585 | 2.12 | 685 | Z6077 | 7.89 | |||||||||||||
| 636 | Z4757 | 5.82 | 686 | zntA | 3.17 | |||||||||||||
| 637 | Z4787 | 4.50 | ||||||||||||||||
| 638 | Z4855 | 2.14 | ||||||||||||||||
| 639 | Z4857 | 2.06 | ||||||||||||||||
| 640 | Z4858 | 2.07 | ||||||||||||||||
| 641 | Z4859 | 2.49 | ||||||||||||||||
| 642 | Z4860 | 2.42 | ||||||||||||||||
| 643 | Z4861 | 2.09 | ||||||||||||||||
| 644 | Z4876 | 2.93 | ||||||||||||||||
| 645 | Z4877 | 2.66 | ||||||||||||||||
| 646 | Z4879 | 2.98 | ||||||||||||||||
| 647 | Z4888 | 2.49 | ||||||||||||||||
| 648 | Z4907 | 3.60 | ||||||||||||||||
| 649 | Z4967 | 2.16 | ||||||||||||||||
| 650 | Z5001 | 2.02 | ||||||||||||||||
References
Bibliography
Antunes, L., & Ferreira, R. (2010). Quorum sensing in bacterial virulence. …, 2271–2282. http://doi.org/10.1099/mic.0.038794-0
Asano, M., & Komiyama, K. (2011). Polymeric immunoglobulin receptor. Journal of Oral Science, 53(2), 147–156. http://doi.org/10.2334/josnusd.53.147
Badea, L., Doughty, S., Nicholls, L., Sloan, J., Robins-Browne, R. M., & Hartland, E. L. (2003). Contribution of Efa1/LifA to the adherence of enteropathogenic Escherichia coli to epithelial cells. Microbial Pathogenesis, 34(5), 205–215. http://doi.org/10.1016/S0882-4010(03)00026-3
Bansal, T., Englert, D., Lee, J., Hegde, M., Wood, T. K., & Jayaraman, A. (2007). Differential effects of epinephrine, norepinephrine, and indole on Escherichia coli O157:H7 chemotaxis, colonization, and gene expression. Infection and Immunity, 75(9), 4597–607. http://doi.org/10.1128/IAI.00630-07
Bardiau, M., Szalo, M., & Mainil, J. G. (2010). Initial adherence of EPEC, EHEC and VTEC to host cells. Veterinary Research, 41(5), 57. http://doi.org/10.1051/vetres/2010029
Barnett Foster, D. (2013). Modulation of the enterohemorrhagic E. coli virulence program through the human gastrointestinal tract. Virulence, 4(4), 315–23. http://doi.org/10.4161/viru.24318
Basak, S., Geng, H., & Jiang, R. (2014). Rewiring global regulator cAMP receptor protein (CRP) to improve E. coli tolerance towards low pH. Journal of Biotechnology, 173(1), 68–75. http://doi.org/10.1016/j.jbiotec.2014.01.015
Baslé, A., Rummel, G., Storici, P., Rosenbusch, J. P., & Schirmer, T. (2006). Crystal Structure of Osmoporin OmpC from E. coli at 2.0 Å. Journal of Molecular Biology, 362(5), 933–942. http://doi.org/10.1016/j.jmb.2006.08.002
Berry, E. D., & Wells, J. E. (2010). Escherichia coli O157:H7: recent advances in research on occurrence, transmission, and control in cattle and the production environment. Advances in food and nutrition research (1st ed., Vol. 60). Elsevier Inc. http://doi.org/10.1016/S1043-4526(10)60004-6
Bolte, S., & Cordelières, F. P. (2006). A guided tour into subcellular colocalization analysis in light microscopy. Journal of Microscopy, 224(3), 213–232. http://doi.org/10.1111/j.1365-2818.2006.01706.x
Brady, M. J., Radhakrishnan, P., Liu, H., Magoun, L., Murphy, K. C., Mukherjee, J., … Leong, J. M. (2011). Enhanced Actin Pedestal Formation by Enterohemorrhagic Escherichia coli O157:H7 Adapted to the Mammalian Host. Frontiers in Microbiology, 2(November), 226. http://doi.org/10.3389/fmicb.2011.00226
Brichta-Harhay, D. M., Guerini, M. N., Arthur, T. M., Bosilevac, J. M., Kalchayanand, N., Shackelford, S. D., … Koohmaraie, M. (2008). Salmonella and Escherichia coli O157:H7 contamination on hides and carcasses of cull cattle presented for slaughter in the United States: an evaluation of prevalence and bacterial loads by immunomagnetic separation and direct plating methods. Applied and Environmental Microbiology, 74(20), 6289–97. http://doi.org/10.1128/AEM.00700-08
Burgos, Y., & Beutin, L. (2010). Common origin of plasmid encoded alpha-hemolysin genes in Escherichia coli. BMC Microbiology, 10, 193. http://doi.org/10.1186/1471-2180-10-193
Callaway, T., & Carr, M. (2009). Diet, Escherichia coli O157: H7, and cattle: a review after 10 years. Current Issues in …, 1(979), 67–80. Retrieved from http://www.horizonpress.com/cimb/v/v11/67.pdf
Caprioli, A., Scavia, G., & Morabito, S. (2013). Public Health Microbiology of Shiga Toxin-Producing Escherichia coli. Microbiology Spectrum, (3), 1–12. http://doi.org/10.1128/microbiolspec.EHEC
Cardone, M. H., Smith, B. L., Mennitt, P. A., Mochly-Rosen, D., Silver, R. B., & Mostov, K. E. (1996). Signal transduction by the polymeric immunoglobulin receptor suggests a role in regulation of receptor transcytosis. Journal of Cell Biology, 133(5), 997–1005. http://doi.org/10.1083/jcb.133.5.997
Carter, M. Q., Louie, J. W., Fagerquist, C. K., Sultan, O., Miller, W. G., & Mandrell, R. E. (2012). Evolutionary silence of the acid chaperone protein HdeB in enterohemorrhagic Escherichia coli O157: H7. Applied and Environmental Microbiology, 78(4), 1004–1014. http://doi.org/10.1128/AEM.07033-11
Carter, M. Q., Parker, C. T., Louie, J. W., Huynh, S., Fagerquist, C. K., & Mandrell, R. E. (2012). RcsB contributes to the distinct stress fitness among Escherichia coli O157:H7 curli variants of the 1993 hamburger-associated outbreak strains. Applied and Environmental Microbiology, 78(21), 7706–19. http://doi.org/10.1128/AEM.02157-12
Cascales, E., & Lloubès, R. (2004). Deletion analyses of the peptidoglycan-associated lipoprotein Pal reveals three independent binding sequences including a TolA box. Molecular Microbiology, 51(3), 873–885. http://doi.org/10.1046/j.1365-2958.2003.03881.x
Castanié-Cornet, M. P., Cam, K., Bastiat, B., Cros, A., Bordes, P., & Gutierrez, C. (2010). Acid stress response in Escherichia coli: Mechanism of regulation of gadA transcription by RcsB and GadE. Nucleic Acids Research, 38(11), 3546–3554. http://doi.org/10.1093/nar/gkq097
Chase-Topping, M., Gally, D., Low, C., Matthews, L., & Woolhouse, M. (2008). Super-shedding and the link between human infection and livestock carriage of Escherichia coli O157. Nature Reviews. Microbiology, 6(12), 904–12. http://doi.org/10.1038/nrmicro2029
Chatterjee, S. N., & Chaudhuri, K. (2012). Outer Membrane Vesicles of Bacteria. http://doi.org/10.1007/978-3-642-30526-9
Choi, S. H., Kim, Y., Oh, S., Oh, S., Chun, T., & Kim, S. H. (2014). Inhibitory effect of skatole (3-methylindole) on enterohemorrhagic Escherichia coli O157: H7 ATCC 43894 biofilm formation mediated by elevated endogenous oxidative stress. Letters in Applied Microbiology, 58(5), 454–461. http://doi.org/10.1111/lam.12212
Clements, A., Young, J. C., Constantinou, N., & Frankel, G. (2012). Infection strategies of enteric pathogenic Escherichia coli, (April), 71–87.
Croxen, M. a, & Finlay, B. B. (2010). Molecular mechanisms of Escherichia coli pathogenicity. Nature Reviews. Microbiology, 8(1), 26–38. http://doi.org/10.1038/nrmicro2265
Croxen, M. a, Law, R. J., Scholz, R., Keeney, K. M., Wlodarska, M., & Finlay, B. B. (2013). Recent advances in understanding enteric pathogenic Escherichia coli. Clinical Microbiology Reviews, 26(4), 822–80. http://doi.org/10.1128/CMR.00022-13
Datsenko, K. a, & Wanner, B. L. (2000). One-step inactivation of chromosomal genes in Escherichia coli K-12 using PCR products. Proceedings of the National Academy of Sciences of the United States of America, 97(12), 6640–5. http://doi.org/10.1073/pnas.120163297
Dave, S., Carmicle, S., Hammerschmidt, S., Pangburn, M. K., & McDaniel, L. S. (2004). Dual roles of PspC, a surface protein of Streptococcus pneumoniae, in binding human secretory IgA and factor H. Journal of Immunology (Baltimore, Md. : 1950), 173(1), 471–477. http://doi.org/10.4049/jimmunol.173.1.471
Dean, P., Maresca, M., & Kenny, B. (2005). EPEC’s weapons of mass subversion. Current Opinion in Microbiology, 8(1), 28–34. http://doi.org/10.1016/j.mib.2004.12.010
Ebel, F., Podzadel, T., Rohde, M., Kresse, A. U., Krämer, S., Deibel, C., … Chakraborty, T. (1998). Initial binding of Shiga toxin-producing Escherichia coli to host cells and subsequent induction of actin rearrangements depend on filamentous EspA- containing surface appendages. Molecular Microbiology, 30(1), 147–161. http://doi.org/10.1046/j.1365-2958.1998.01046.x
Etcheverría, A. I., Padola, N. L., & Stec, K. (2013). Factors involved in virulence and cattle colonization Shiga toxin-producing Escherichia coli, 4(5), 366–372.
Farfan, M. J., Cantero, L., Vergara, A., Vidal, R., & Torres, A. G. (2013). The long polar fimbriae of STEC O157: H7 induce expression of pro-inflammatory markers by intestinal epithelial cells. Veterinary Immunology and Immunopathology, 152(1–2), 126–131. http://doi.org/10.1016/j.vetimm.2012.09.017
Farfan, M. J., & Torres, A. G. (2012). Molecular mechanisms that mediate colonization of Shiga toxin-producing Escherichia coli strains. Infection and Immunity, 80(3), 903–13. http://doi.org/10.1128/IAI.05907-11
Fink, R. C., Black, E. P., Hou, Z., Sugawara, M., Sadowsky, M. J., & Diez-Gonzalez, F. (2012). Transcriptional Responses of Escherichia coli K-12 and O157:H7 Associated with Lettuce Leaves. Applied and Environmental Microbiology, 78(6), 1752–1764. http://doi.org/10.1128/AEM.07454-11
Foster, J. W. (2004). Escherichia coli acid resistance: tales of an amateur acidophile. Nature Reviews. Microbiology, 2(11), 898–907. http://doi.org/10.1038/nrmicro1021
Frirdich, E., & Whitfield, C. (2005). Lipopolysaccharide inner core oligosaccharide structure and outer membrane stability in human pathogens belonging to the Enterobacteriaceae. Journal of Endotoxin Research, 11(3), 133–44. http://doi.org/10.1179/096805105X46592
Gajiwala, K. S., & Burley, S. K. (2000). HDEA, a periplasmic protein that supports acid resistance in pathogenic enteric bacteria. Journal of Molecular Biology, 295(3), 605–612. http://doi.org/10.1006/jmbi.1999.3347
Gan, Y. J., Chodosh, J., Morgan, A., & Sixbey, J. W. (1997). Epithelial cell polarization is a determinant in the infectious outcome of immunoglobulin A-mediated entry by Epstein-Barr virus. Journal of Virology, 71(1), 519–26. Retrieved from http://www.pubmedcentral.nih.gov/articlerender.fcgi?artid=191081&tool=pmcentrez&rendertype=abstract
Garmendia, J. (2005). MINIREVIEW Enteropathogenic and Enterohemorrhagic Escherichia coli Infections :, 73(5), 2573–2585. http://doi.org/10.1128/IAI.73.5.2573
Gonyar, L. A., & Kendall, M. M. (2014). Ethanolamine and choline promote expression of putative and characterized fimbriae in enterohemorrhagic Escherichia coli O157:H7. Infection and Immunity, 82(1), 193–201. http://doi.org/10.1128/IAI.00980-13
Gyles, C. L. (2007). Shiga toxin-producing Escherichia coli: an overview. Journal of Animal Science, 85(13 Suppl), E45-62. http://doi.org/10.2527/jas.2006-508
Hall, A. J., Wikswo, M. E., Manikonda, K., Roberts, V. A., Yoder, J. S., & Gould, L. H. (2013). Acute gastroenteritis surveillance through the National Outbreak Reporting System, United States. Emerging Infectious Diseases, 19(8), 1305–1309. http://doi.org/10.3201/eid1908.130482
Hammerschmidt, S., Tillig, M. P., Wolff, S., Vaerman, J.-P., & Chhatwal, G. S. (2002). Species-specific binding of human secretory component to SpsA protein of Streptococcus pneumoniae via a hexapeptide motif. Molecular Microbiology, 36(3), 726–736. http://doi.org/10.1046/j.1365-2958.2000.01897.x
Hauf, N., & Chakraborty, T. (2003). Suppression of NF- B Activation and Proinflammatory Cytokine Expression by Shiga Toxin-Producing Escherichia coli. The Journal of Immunology, 170(4), 2074–2082. http://doi.org/10.4049/jimmunol.170.4.2074
Hegde, N. V, Cote, R., Jayarao, B. M., Muldoon, M., Lindpaintner, K., Kapur, V., & Debroy, C. (2012). Detection of the top six non-O157 Shiga toxin-producing Escherichia coli O groups by ELISA. Foodborne Pathogens and Disease, 9(11), 1044–8. http://doi.org/10.1089/fpd.2012.1231
Heiman, K. E., Mody, R. K., Johnson, S. D., Griffin, P. M., & Gould, L. H. (2015). Escherichia coli O157 Outbreaks in the United States, 2003–2012. Emerging Infectious Diseases, 21(8), 1293–1301. http://doi.org/10.3201/eid2108.141364
Ho, T. D., Davis, B. M., Ritchie, J. M., & Waldor, M. K. (2008). Type 2 secretion promotes enterohemorrhagic Escherichia coli adherence and intestinal colonization. Infection and Immunity, 76(5), 1858–65. http://doi.org/10.1128/IAI.01688-07
Hommais, F., Krin, E., Coppée, J. Y., Lacroix, C., Yeramian, E., Danchin, A., & Bertin, P. (2004). GadE (YhiE): A novel activator involved in the response to acid environment in Escherichia coli. Microbiology, 150(1), 61–72. http://doi.org/10.1099/mic.0.26659-0
House, B., Kus, J. V, Prayitno, N., Mair, R., Que, L., Chingcuanco, F., … Barnett Foster, D. (2009). Acid-stress-induced changes in enterohaemorrhagic Escherichia coli O157 : H7 virulence. Microbiology (Reading, England), 155(Pt 9), 2907–18. http://doi.org/10.1099/mic.0.025171-0
Hunt, J. M. (2010). Shiga toxin-producing Escherichia coli (STEC). Clinics in Laboratory Medicine, 30(1), 21–45. http://doi.org/10.1016/j.cll.2009.11.001
Iovino, F., Molema, G., & Bijlsma, J. J. E. (2014a). Platelet endothelial cell adhesion molecule-1, a putative receptor for the adhesion of Streptococcus pneumoniae to the vascular endothelium of the blood-brain barrier. Infection and Immunity, 82(9), 3555–3566. http://doi.org/10.1128/IAI.00046-14
Iovino, F., Molema, G., & Bijlsma, J. J. E. (2014b). Streptococcus pneumoniae interacts with pIgR expressed by the brain microvascular endothelium but does not co-localize with PAF receptor. PLoS ONE, 9(5). http://doi.org/10.1371/journal.pone.0097914
Jeon, S. J., Elzo, M., DiLorenzo, N., Lamb, G. C., & Jeong, K. C. (2013). Evaluation of animal genetic and physiological factors that affect the prevalence of Escherichia coli O157 in cattle. PloS One, 8(2), e55728. http://doi.org/10.1371/journal.pone.0055728
Ji Youn Lim, Jang W. Yoon, C. J. H. (2013). A Brief Overview of Escherichia coli O157:H7 and Its Plasmid O157, 20(1), 5–14.
Johannes, L., & Römer, W. (2010). Shiga toxins–from cell biology to biomedical applications. Nature Reviews. Microbiology, 8(2), 105–16. http://doi.org/10.1038/nrmicro2279
Johansen, F.-E., & Kaetzel, C. S. (2011). Regulation of the polymeric immunoglobulin receptor and IgA transport: new advances in environmental factors that stimulate pIgR expression and its role in mucosal immunity. Mucosal Immunology, 4(6), 598–602. http://doi.org/10.1038/mi.2011.37
Ju, W., Shen, J., Toro, M., Zhao, S., & Meng, J. (2013). Distribution of pathogenicity islands OI-122, OI-43/48, and OI-57 and a high-pathogenicity island in Shiga toxin-producing Escherichia coli. Applied and Environmental Microbiology, 79(11), 3406–12. http://doi.org/10.1128/AEM.03661-12
Kaetzel, C. S. (2001). Polymeric Ig receptor: Defender of the fort or Trojan Horse? Current Biology, 11(1), R35–R38. http://doi.org/10.1016/S0960-9822(00)00041-5
Kaetzel, C. S. (2005). The polymeric immunoglobulin receptor: bridging innate and adaptive immune responses at mucosal surfaces. Immunological Reviews, 206, 83–99. http://doi.org/10.1111/j.0105-2896.2005.00278.x
Kaetzel, C. S. (2014). Coevolution of Mucosal Immunoglobulins and the Polymeric Immunoglobulin Receptor: Evidence That the Commensal Microbiota Provided the Driving Force. ISRN Immunology, 2014, 1–20. http://doi.org/10.1155/2014/541537
Karpman, D., & Ståhl, A.-L. (2014). Enterohemorrhagic Escherichia coli Pathogenesis and the Host Response. Microbiology Spectrum, 2(5), 1–15. http://doi.org/10.1128/microbiolspec.EHEC-0009-2013
Kendall, M. M., Gruber, C. C., Parker, C. T., & Sperandio, V. (2012). Ethanolamine controls expression of genes encoding components involved in interkingdom signaling and virulence in enterohemorrhagic escherichia coli O157:H7. MBio, 3(3), 1–10. http://doi.org/10.1128/mBio.00050-12
Kim, J. C., Yoon, J. W., Kim, C.-H., Park, M.-S., & Cho, S.-H. (2012). Repression of flagella motility in enterohemorrhagic Escherichia coli O157:H7 by mucin components. Biochemical and Biophysical Research Communications, 423(4), 789–92. http://doi.org/10.1016/j.bbrc.2012.06.041
Kimmitt, P., Harwood, C., & Barer, M. (2000). Toxin gene expression by shiga toxin-producing Escherichia coli: the role of antibiotics and the bacterial SOS response. Emerging Infectious Diseases, 6(5), 458–465. Retrieved from http://www.ncbi.nlm.nih.gov/pmc/articles/PMC2627954/
Kopan, R., Goate, A., Dunn, K. W., Kamocka, M. M., & McDonald, J. H. (2011). A practical guide to evaluating colocalization in biological microscopy. Genes & Development, 46202(314), 723–742. http://doi.org/10.1152/ajpcell.00462.2010.
Kouki, A., Haataja, S., Loimaranta, V., Pulliainen, A. T., Nilsson, U. J., & Finne, J. (2011). Identification of a novel streptococcal adhesin P (SadP) protein recognizing galactosyl-??1-4-galactose-containing glycoconjugates: Convergent evolution of bacterial pathogens to binding of the same host receptor. Journal of Biological Chemistry, 286(45), 38854–38864. http://doi.org/10.1074/jbc.M111.260992
Kovacs-Simon, A., Titball, R. W., & Michell, S. L. (2011). Lipoproteins of bacterial pathogens. Infection and Immunity, 79(2), 548–561. http://doi.org/10.1128/IAI.00682-10
Kudva, I. T., & Dean-Nystrom, E. a. (2011). Bovine recto-anal junction squamous epithelial (RSE) cell adhesion assay for studying Escherichia coli O157 adherence. Journal of Applied Microbiology, 111(5), 1283–94. http://doi.org/10.1111/j.1365-2672.2011.05139.x
Landstorfer, R., Simon, S., Schober, S., Keim, D., Scherer, S., & Neuhaus, K. (2014). Comparison of strand-specific transcriptomes of enterohemorrhagic Escherichia coli O157:H7 EDL933 (EHEC) under eleven different environmental conditions including radish sprouts and cattle feces. BMC Genomics, 15, 353. http://doi.org/10.1186/1471-2164-15-353
Law, D. (2000). The history and evolution of Escherichia coli O157 and other Shiga toxin-producing E. coli. World Journal of Microbiology and Biotechnology, 16, 701–709. http://doi.org/10.1023/A:1008927820535
Li, J., & Hovde, C. J. (2007). Expression profiles of bovine genes in the rectoanal junction mucosa during colonization with Escherichia coli O157:H7. Applied and Environmental Microbiology, 73(7), 2380–5. http://doi.org/10.1128/AEM.02262-06
Lim, J. Y., Yoon, J. W., & Hovde, C. J. (2010). A brief overview of Escherichia coli O157:H7 and its plasmid O157. Journal of Microbiology and Biotechnology. http://doi.org/10.4014/jmb.0908.08007
Lin, J., Smith, M. P., Chapin, K. C., Baik, H. S., Bennett, G. N., & Foster, J. W. (1996). Mechanisms of acid resistance in enterohemorrhagic Escherichia coli. Appl Environ Microbiol, 62(9), 3094–3100. Retrieved from http://www.ncbi.nlm.nih.gov/entrez/query.fcgi?cmd=Retrieve&db=PubMed&dopt=Citation&list_uids=8795195
Liu, Y. F., Yan, J. J., Lei, H. Y., Teng, C. H., Wang, M. C., Tseng, C. C., & Wu, J. J. (2012). Loss of outer membrane protein C in Escherichia coli contributes to both antibiotic resistance and escaping antibody-dependent bactericidal activity. Infection and Immunity, 80(5), 1815–1822. http://doi.org/10.1128/IAI.06395-11
Luzader, D. H., Clark, D. E., Gonyar, L. a, & Kendall, M. M. (2013). EutR is a direct regulator of genes that contribute to metabolism and virulence in enterohemorrhagic Escherichia coli O157:H7. Journal of Bacteriology, 195(21), 4947–53. http://doi.org/10.1128/JB.00937-13
Mahajan, A., Currie, C. G., Mackie, S., Tree, J., McAteer, S., McKendrick, I., … Smith, D. G. E. (2009). An investigation of the expression and adhesin function of H7 flagella in the interaction of Escherichia coli O157 : H7 with bovine intestinal epithelium. Cellular Microbiology, 11(1), 121–37. http://doi.org/10.1111/j.1462-5822.2008.01244.x
Masuda, N., & Church, G. M. (2003). Regulatory network of acid resistance genes in Escherichia coli. Molecular Microbiology, 48(3), 699–712. http://doi.org/10.1046/j.1365-2958.2003.03477.x
Mates, A. K., Sayed, A. K., & Foster, J. W. (2007). Products of the Escherichia coli acid fitness island attenuate metabolite stress at extremely low pH and mediate a cell density-dependent acid resistance. Journal of Bacteriology, 189(7), 2759–2768. http://doi.org/10.1128/JB.01490-06
Matthews, L., Low, J. C., Gally, D. L., Pearce, M. C., Mellor, D. J., Heesterbeek, J. A. P., … Woolhouse, M. E. J. (2005). Heterogeneous shedding of Escherichia coli O157 in cattle and its implications for control.
McWilliams, B. D., & Torres, A. G. (2014). Enterohemorrhagic Escherichia coli Adhesins. Microbiology Spectrum, 2(3), EHEC00032013. http://doi.org/10.1128/microbiolspec.EHEC-0003-2013
Mellies, J. A. Y. L., & Lorenzen, E. (2014). Enterohemorrhagic Escherichia coli Virulence Gene Regulation. Microbiology Spectrum, 2(4), 1–17. http://doi.org/10.1128/microbiolspec.EHEC-0004-2013.Correspondence
Melton-celsa, A., Mohawk, K., Teel, L., & Brien, A. O. (n.d.). Pathogenesis of Shiga-Toxin Producing Escherichia coli, (September 2011), 67–103. http://doi.org/10.1007/82
Mohawk, K. L., & O’Brien, A. D. (2011). Mouse Models of Escherichia coli O157:H7 Infection and Shiga Toxin Injection. Journal of Biomedicine and Biotechnology, 2011, 1–17. http://doi.org/10.1155/2011/258185
Mora, A., Blanco, M., Blanco, J. E., Alonso, M. P., Dhabi, G., Thomson-Carter, F., … Blanco, J. (2004). Phage types and genotypes of shiga toxin-producing Escherichia coli O157:H7 isolates from humans and animals in spain: identification and characterization of two predominating phage types (PT2 and PT8). Journal of Clinical Microbiology, 42(9), 4007–15. http://doi.org/10.1128/JCM.42.9.4007-4015.2004
Moreau, Ma. (2013). GENOMIC AND MOLECULAR ANALYSIS OF THE UNIQUE PHENOTYPES OF AN E. COLI O157:H7 SUPER SHEDDER ISOLATE.
Morgan, J. K., Carroll, R. K., Harro, C. M., Vendura, K. W., Shaw, L. N., & Riordan, J. T. (2015). Global regulator of virulence A (GrvA) coordinates expression of discrete pathogenic mechanisms in enterohemorrhagic Escherichia coli through interactions with GadW-GadE. Journal of Bacteriology, 198(3), 394–409. http://doi.org/10.1128/JB.00556-15
Mostov, K. E., & Blobel, G. (1982). A transmembrane precursor of secretory component. The Journal of Biological Chemistry, 257(19), 11816–11821.
Naylor, S. W., Low, J. C., Besser, T. E., Mahajan, A., Gunn, G. J., Pearce, M. C., … Mckendrick, I. J. (2003). Lymphoid Follicle-Dense Mucosa at the Terminal Rectum Is the Principal Site of Colonization of Enterohemorrhagic Escherichia coli O157 : H7 in the Bovine Host. http://doi.org/10.1128/IAI.71.3.1505
Naylor, S. W., Nart, P., Sales, J., Flockhart, A., Gally, D. L., & Low, J. C. (2007). Impact of the direct application of therapeutic agents to the terminal recta of experimentally colonized calves on Escherichia coli O157:H7 shedding. Applied and Environmental Microbiology, 73(5), 1493–500. http://doi.org/10.1128/AEM.01736-06
Nguyen, Y., & Sperandio, V. (2012). Enterohemorrhagic E. coli (EHEC) pathogenesis. Frontiers in Cellular and Infection Microbiology, 2(July), 90. http://doi.org/10.3389/fcimb.2012.00090
Nguyen, Y., Sperandio, V., Padola, N. L., & Starai, V. J. (2012). Enterohemorrhagic E. coli (EHEC) pathogenesis. Frontiers in Cellular and Infection Microbiology, 2(90), 1–7. http://doi.org/10.3389/fcimb.2012.00090
Njoroge, J., & Sperandio, V. (2012). Enterohemorrhagic Escherichia coli virulence regulation by two bacterial adrenergic kinases, QseC and QseE. Infection and Immunity, 80(2), 688–703. http://doi.org/10.1128/IAI.05921-11
Norioka, S., Ramakrishnan, G., Ikenaka, K., & Inouye, M. (1986). Interaction of a transcriptional activator, OmpR, with reciprocally osmoregulated genes, ompF and ompC, of Escherichia coli. Journal of Biological Chemistry, 261(36), 17113–17119.
Ogasawara, H., Yamada, K., Kori, A., Yamamoto, K., & Ishihama, A. (2010). Regulation of the Escherichia coli csgD promoter: interplay between five transcription factors. Microbiology (Reading, England), 156(Pt 8), 2470–83. http://doi.org/10.1099/mic.0.039131-0
Pacheco, A. R., & Sperandio, V. (2012). Shiga toxin in enterohemorrhagic E.coli: regulation and novel anti-virulence strategies. Frontiers in Cellular and Infection Microbiology, 2(June), 81. http://doi.org/10.3389/fcimb.2012.00081
Pfaffl, M. W. (2001). A new mathematical model for relative quantification in real-time RT-PCR. Nucleic Acids Research, 29(9), e45. http://doi.org/10.1093/nar/29.9.e45
Phalipon, A., & Corthésy, B. (2003). Novel functions of the polymeric Ig receptor: well beyond transport of immunoglobulins. Trends in Immunology, 24(2), 55–58. Retrieved from http://www.sciencedirect.com/science/article/pii/S1471490602000315
Pilsl, H., Smajs, D., & Braun, V. (1999). Characterization of Colicin S4 and Its Receptor , OmpW , a Minor Protein of the Escherichia coli Outer Membrane Characterization of Colicin S4 and Its Receptor , OmpW , a Minor Protein of the Escherichia coli Outer Membrane. Journal of Bacteriology, 181(11), 3578–80.
Piskurich, J. F., Youngman, K. R., Phillips, K. M., Hempen, P. M., Blanchard, M. H., France, J. A., & Kaetzel, C. S. (1997). Transcriptional regulation of the human polymeric immunoglobulin receptor gene by interferon-γ. Molecular Immunology, 34(1), 75–91. http://doi.org/10.1016/S0161-5890(96)00079-X
Rahal, E. A., Kazzi, N., Nassar, F. J., & Matar, G. M. (2012). Escherichia coli O157:H7—Clinical aspects and novel treatment approaches. Frontiers in Cellular and Infection Microbiology, 2(November), 1–7. http://doi.org/10.3389/fcimb.2012.00138
Rangel, J. M., Sparling, P. H., Crowe, C., Griffin, P. M., & Swerdlow, D. L. (2005). O157:H7 Outbreaks in the US 1982 – 2002, 11(4).
Rendón, M. a, Saldaña, Z., Erdem, A. L., Monteiro-Neto, V., Vázquez, A., Kaper, J. B., … Girón, J. a. (2007). Commensal and pathogenic Escherichia coli use a common pilus adherence factor for epithelial cell colonization. Proceedings of the National Academy of Sciences of the United States of America, 104(25), 10637–10642. http://doi.org/10.1073/pnas.0704104104
Rhoades, J. R., Duffy, G., & Koutsoumanis, K. (2009). Prevalence and concentration of verocytotoxigenic Escherichia coli, Salmonella enterica and Listeria monocytogenes in the beef production chain: a review. Food Microbiology, 26(4), 357–76. http://doi.org/10.1016/j.fm.2008.10.012
Rivas, L., Fegan, N., & Dykes, G. a. (2008). Expression and putative roles in attachment of outer membrane proteins of Escherichia coli O157 from planktonic and sessile culture. Foodborne Pathogens and Disease, 5(2), 155–64. http://doi.org/10.1089/fpd.2007.0052
Robinson, C. M., Sinclair, J. F., Smith, M. J., & O’Brien, A. D. (2006). Shiga toxin of enterohemorrhagic Escherichia coli type O157:H7 promotes intestinal colonization. Proceedings of the National Academy of Sciences of the United States of America, 103(25), 9667–72. http://doi.org/10.1073/pnas.0602359103
Rojas, R., & Apodaca, G. (2002). Immunoglobulin transport across polarized epithelial cells. Nature Reviews. Molecular Cell Biology, 3(12), 944–955. http://doi.org/10.1038/nrm972
Sauer, M., Hantke, K., & Braun, V. (1987). Ferric-coprogen receptor FhuE of Escherichia coli: Processing and sequence common to all TonB-dependent outer membrane receptor proteins. Journal of Bacteriology, 169(5), 2044–2049.
Sayed, A. K., Odom, C., & Foster, J. W. (2007). The Escherichia coli AraC-family regulators GadX and GadW activate gadE, the central activator of glutamate-dependent acid resistance. Microbiology, 153(8), 2584–2592. http://doi.org/10.1099/mic.0.2007/007005-0
Schembri, M. A., Kjaergaard, K., & Klemm, P. (2003). Global gene expression in Escherichia coli biofilms. Molecular Microbiology, 48(1), 253–267. http://doi.org/10.1046/j.1365-2958.2003.03432.x
Schmidt, M. A. (2010). LEEways: tales of EPEC, ATEC and EHEC. Cellular Microbiology, 12(11), 1544–52. http://doi.org/10.1111/j.1462-5822.2010.01518.x
Schneeman, T. a., Bruno, M. E. C., Schjerven, H., Johansen, F.-E. F.-E. F.-E. E. F.-E., Chady, L., Kaetzel, C. S., … Smith, D. R. G. E. (2005). Regulation of the polymeric Ig receptor by signaling through TLRs 3 and 4: linking innate and adaptive immune responses. Journal of Immunology (Baltimore, Md. : 1950), 175(1), 376–384. http://doi.org/175/1/376 [pii]
Schwechheimer, C., & Kuehn, M. J. (2015). Outer-membrane vesicles from Gram-negative bacteria: Biogenesis and functions. Nature Reviews Microbiology, 13(10), 605–619. http://doi.org/10.1038/nrmicro3525
Sharma, V. K., Bearson, S. M. D., & Bearson, B. L. (2010). Evaluation of the effects of sdiA, a luxR homologue, on adherence and motility of Escherichia coli O157:H7. Microbiology, 156(5), 1303–1312. http://doi.org/10.1099/mic.0.034330-0
Shin, S., Lu, G., Cai, M., & Kim, K.-S. (2005). Escherichia coli outer membrane protein A adheres to human brain microvascular endothelial cells. Biochemical and Biophysical Research Communications, 330(4), 1199–1204. http://doi.org/10.1016/j.bbrc.2005.03.097
Smith, J. L., Fratamico, P. M., & Gunther, N. W. (2014). Shiga toxin-producing escherichia coli. Advances in Applied Microbiology (1st ed., Vol. 86). Copyright © 2014 Elsevier Inc. All rights reserved. http://doi.org/10.1016/B978-0-12-800262-9.00003-2
Sperandio, V., Torres, A. G., Jarvis, B., Nataro, J. P., & Kaper, J. B. (2003). Bacteria-host communication: the language of hormones. Proceedings of the National Academy of Sciences of the United States of America, 100(15), 8951–6. http://doi.org/10.1073/pnas.1537100100
Stenutz, R., Weintraub, A., & Widmalm, G. (2006). The structures of Escherichia coli O-polysaccharide antigens. FEMS Microbiology Reviews, 30(3), 382–403. http://doi.org/10.1111/j.1574-6976.2006.00016.x
Sunagawa, K., Omagari, D., Nishiyama, M., Asano, M., Okudera, M., Sugitani, M., … Komiyama, K. (2013). Distinct functional regions of the human polymeric immunoglobulin receptor. Scandinavian Journal of Immunology, 78(4), 339–344. http://doi.org/10.1111/sji.12093
Tanaro, J. D., Galli, L., Lound, L. H., Leotta, G. a, Piaggio, M. C., Carbonari, C. C., … Rivas, M. (2012). Non-O157:H7 Shiga toxin-producing Escherichia coli in bovine rectums and surface water streams on a beef cattle farm in Argentina. Foodborne Pathogens and Disease, 9(10), 878–84. http://doi.org/10.1089/fpd.2012.1182
Torres, A. G., & Payne, S. M. (1997). Haem iron-transport system in enterohaemorrhagic Escherichia coli O157:H7. Molecular Microbiology, 23(4), 825–833. http://doi.org/10.1046/j.1365-2958.1997.2641628.x
Tramonti, A., De Canio, M., & De Biase, D. (2008). GadX/GadW-dependent regulation of the Escherichia coli acid fitness island: Transcriptional control at the gadY-gadW divergent promoters and identification of four novel 42 bp GadX/GadW-specific binding sites. Molecular Microbiology, 70(4), 965–982. http://doi.org/10.1111/j.1365-2958.2008.06458.x
Tramonti, A., De Canio, M., Delany, I., Scarlato, V., & De Biase, D. (2006). Mechanisms of transcription activation exerted by GadX and GadW at the gadA and gadBC gene promoters of the glutamate-based acid resistance system in Escherichia coli. Journal of Bacteriology, 188(23), 8118–8127. http://doi.org/10.1128/JB.01044-06
Uhlich, G. a, Uhlich, G. a, Keen, J. J. E., Keen, J. J. E., Elder, R. O., & Elder, R. O. (2002). Variations in the csgD promoter of Escherichia coli O157: H7 associated with increased virulence in mice and increased invasion of HEp-2 cells. Infection and Immunity, 70(1), 395–399. http://doi.org/10.1128/IAI.70.1.395
Vanaja, S. K., Bergholz, T. M., Whittam, T. S., Kailasan Vanaja, S., Bergholz, T. M., & Whittam, T. S. (2009). Characterization of the Escherichia coli O157:H7 Sakai GadE regulon. Journal of Bacteriology, 191(6), 1868–77. http://doi.org/10.1128/JB.01481-08
Vogt, J., & Schulz, G. E. (1999). The structure of the outer membrane protein OmpX from Escherichia coil reveals possible mechanisms of virulence. Structure, 7(10), 1301–1309. http://doi.org/10.1016/S0969-2126(00)80063-5
Wang, Y. (2002). The Function of OmpA in Escherichia coli. Biochemical and Biophysical Research Communications, 292(2), 396–401. http://doi.org/10.1006/bbrc.2002.6657
Wong, A. R. C., Pearson, J. S., Bright, M. D., Munera, D., Robinson, K. S., Lee, S. F., … Hartland, E. L. (2011). Enteropathogenic and enterohaemorrhagic Escherichia coli: even more subversive elements. Molecular Microbiology, 80(6), 1420–38. http://doi.org/10.1111/j.1365-2958.2011.07661.x
Wu, V. C. H., Qiu, X., de los Reyes, B. G., Lin, C. S., & Pan, Y. (2009). Application of cranberry concentrate (Vaccinium macrocarpon) to control Escherichia coli O157:H7 in ground beef and its antimicrobial mechanism related to the downregulated slp, hdeA and cfa. Food Microbiology, 26(1), 32–38. http://doi.org/10.1016/j.fm.2008.07.014
Zhao, B., & Houry, W. a. (2010). Acid stress response in enteropathogenic gammaproteobacteria: an aptitude for survival. Biochemistry and Cell Biology = Biochimie et Biologie Cellulaire, 88(2), 301–314. http://doi.org/10.1139/o09-182
Zwir, I., Shin, D., Kato, a, Nishino, K., Latifi, T., Solomon, F., … Groisman, E. a. (2005). Dissecting the PhoP regulatory network of Escherichia coli and Salmonella enterica. Proc Natl Acad Sci U S A, 102(8), 2862–2867. http://doi.org/10.1073/pnas.0408238102
Cite This Work
To export a reference to this article please select a referencing stye below:
Related Services
View all


Related Content
All TagsContent relating to: "Biomedical Science"
Biomedical Science focuses on how cells, organs and systems function in the human body and underpins much of modern medicine. Biomedical Science applies parts of natural and/or formal sciences to help develop advances in healthcare.
Related Articles

DMCA / Removal Request
If you are the original writer of this dissertation and no longer wish to have your work published on the UKDiss.com website then please: