Comparing Continuous Walking Trials and Short Walking Trails for Gait Parameters
Info: 7265 words (29 pages) Dissertation
Published: 16th Dec 2019
Tagged: PhysiologyPhysiotherapy
1.1 Introduction
Walking erect with rhythmic co-ordination of peripheral appendages is a standout amongst the principle recognizing features about human beings in comparison with animals in energy efficiency during locomotion (Michael D. Sockol et al., 2007). Human walking is a voluntary action involving complex interactions between the brain, peripheral nervous system, muscles, bones and joints. Ordinary walk incorporates a complex arrangement of appendage movements that move the body in a way that is less energy consuming, stable and shock absorbing by the joints. Confusion in whatever about these frameworks might prompt abnormalities for walk. Any abnormalities among these systems can lead to gait pattern variations.
Gait examination will be characterized similarly as an precise contemplate about human walking utilizing experienced eye and knowledge of a clinician helped by sophisticated instruments for measuring body movements , mechanics and muscle movements (Whittle, 2007). These advancements of gait examination may be parallel to, and is enchanting as the history for science itself. (Steindler, 1953) Portrayed Giovani Borelli a student of Galileo as one of the pioneer in the investigation of mankind’s gait and its analysis. This is because of the key idea of muscle and tendon activities with innervations of the limbs portrayed by Borelli, and determination of the centre of mass. Borelli is likewise credited for performing those first of kind in gait analysis (Baker, 2007). Since the renaissance time, Gait examination might have been primarily dependent upon perception and this included eye examination of the patient’s walk. Eventually of late gait analysis as advanced as an exploratory field in itself, also may be prominently known as quantitative gait analysis currently.
Gait analysis are done usually to identify the variabilities in the parameters of gait of a person and problems associated with it. Gait is usually analysed in a variety of methods ranging from naked eye visualisation, to high end camera captured motion (3D or video based) analysis in a specialized gait lab. The ‘stand-alone’ method for measurement parameters of human gait is considered to be the force-plate and/or camera based (3D or video based) motion capture systems (Scanaill CN et al., 2011). Measure of distance, stability and time taken are other parameters utilized by various gait assessing methods. There are more gait assessment tools which are used on the older adult. Gait variations assessed by naked human eyes refers to qualitative methods (Rancho Los Amigos National Rehabilitation Center, 2001; McGinley JL et al., 2003). This type of analysis is fast, easy and less expensive, unlike some of the gait analysis techniques which utilize other Gait lab specialized equipment’s.
Gait training is standout amongst the most often prescribed rehabilitation strategies for the older people due to the fact gait is the most common of all human development and, as such, any pathology that impacts it calls for immediate attention. The best assessment indicator of disability and frailty among older adults would be the variations in gait speed (Studenski et al., 2011). Typical changes in gait with older adults are reduced gait speed, decreased stride length and increased double support time (Perry & Burnfield, 2010). In addition, executive function and visual deficits impact gait variability and increases fall risk in this population (van Iersel et al., 2008) (Bock & Beurskens, 2011). Hence gait monitoring becomes critical in analysing an underlying cause and provide a solution specifically. The healthcare provider must consider that many specific medical conditions of that particular patient may contribute to gait deviations during Gait assessment.
Gait speed has for some time been recognized as a worldwide descriptor of stride quality, furthermore, consequently is a principal result measure in any Gait evaluation. A few other normally utilized result factors, for example, ground reaction force, joint kinetics, least toe ground clearance, are influenced by changes in Gait speed. Moreover, between trial fluctuation in normal walking speed has been found to increase when information are gathered between short walking trials, contrasted with a continuous walking trails, in adults. This recommends fluctuation in speed-subordinate measures might be influenced by the decision of Short walking trials versus continuous walking as a convention. Changeability in a result measure will influence any factual test, and any variability could demonstrate some pathology. As needs be, the decision of convention itself may influence revealed results, and the environmental legitimacy of the investigation.
In this study, three-dimensional developmental distinct data will be captured by high resolution cameras which will pick infra-red light reflected by retro reflective markers put on the volunteer. Force plates on the ground measures those response drives on the limbs and joints. The information hence gathered will be analysed at workstation (Vicon Nexus) computer program which will provide the joint angles, joint and muscle strengths (kinetics and kinematics) throughout gait cycle. These information can be helpful in determining any pathology in walking. Additionally, electrodes can be placed alongside particular muscles should assemble electromyography information of muscle movement. The ultimate point of this kind of analysis may be helpful for the clinician for choosing a suitable treatment for the patients in clinical practice.
The Vicon® system will be one such cutting edge walk Investigation framework being used in the Institute of Motion Analysis and Research (IMAR), University of Dundee. (IMAR). As it is difficult to compare different data sets for the same patient or compare results of one patient with another with observation of human eyes.
Hence, the motivation behind this examination was to explore the impact of short walking trail versus continuous walking (lab set up and normal level ground walking) trials on gait speed and if any gait measurement fluctuation, in adults. We assumed that gait speed fluctuation would be higher amongst short walking trials compared with continuous walking, because of increasing velocity of the entire body’s centre of mass amid the start and end stages engaged with each short walking trial, and would not be distinctive among adults. In addition we estimated that the average normal walking speed would be comparatively less for short walking trials than continuous walking trails among adults, because of the acceleration and deceleration phase during the start and end periods of the gait cycle bringing about the ‘steady-state’ walking being slower.
1.2 Aim and objectives
The aim of this study is to assess whether the continuous walking trials give more realistic gait parameters compared to short walking trails. The objectives used to achieve this aim are, to capture 3D data from healthy volunteers over two different walking distances and compare them using:
- Vicon motion capture system
- Analyse kinematics and kinetic data from captured data
- dynamic model with short walk and continuous walk,
- clinically approved Plug in gait model and
- Graphic and statistical methods.
The results from this study may help clinicians and researchers use this system with confidence to critically assess their data. Baseline data of the patient’s gait parameters can then be stored for future precise comparison.
CHAPTER 2
2.1 literature review
The current study is assessing the Gait parameters variability (more realistic) between continuous walking (Lab walking and natural walk in the level ground) and short walking trails. Comparison of the data collected from normal volunteers to which gives more realistic data. Thus, it is important to understand the normal walking pattern, different movements occurring in the joints of lower limbs and forces acting upon them, but also to understand the different methods of gait examination.
The movements of the limbs of the human body is described classically using three different planes as illustrated in Figure 2.1. And Figure 2.2
2.2 Human gait
Normal human walking is defined as rhythmic co-ordination of peripheral appendages of both upper limbs and lower limbs to move the body from one location to another while maintaining normal posture (Miller & Thompson, 2015). At any given point of time one foot must be in contact with the ground all the time (single-limb support). During running there is a phase of gait cycle where both feet are off the ground (flight phase). Gait is the manner or style of walking, and is divided basically into two different phases (Whittle, 2007).
2.2.1 Gait Cycle
The gait is stated as movement of a single lower limb from one foot heel strike to the next foot heel strike (Gage, et al., 1995). In the traditional description, the gait cycle is basically divided in two phases: stance phase and swing phase (Figure 2.2). In the former, the foot is in contact with the ground and it comprises of 60 percent of the cycle, and in the later, the foot is moving forwards through the air for the remaining 40 percent of the cycle period (Whittle, 2007).
Figure 2.2 Phases of the Gait Cycle
The stance phase is further divided into four distinct events (Gage, et al., 1995)
- Heel strike: this is at the beginning of the stance phase when one side heel touches the ground and ankle plantar flexes. Initial contact is the term used sometimes instead of heel strike, as in some pathological gaits, the heel does not strike first.
- Mid-stance: the foot is firmly planted on the ground and the bodyweight is transmitted forwards as the ankle is dorsiflexed.
- Terminal stance: it occurs next with plantarflexion of the ankle and foot and the heel is lifted off the ground.
- Toe off: this is the last event in stance phase when body moves forwards, foot is plantar flexed and toes are lifted off the ground.
Similarly swing phase has three distinct events (Gage, 1991):
- Initial swing or acceleration: this begins with toe off of the same foot in the cycle; the hip and knee flex and the ankle dorsiflexes to clear the foot from the ground.
- Mid-swing: the foot is carried forwards through the air.
- Terminal swing or deceleration: this is the conclusion of the swing or deceleration phase of the foot where the knee extends and the ankle begins to plantar flex to prepare the foot for the next heel strike and the cycle begins again.
Both feet go synchronically through the same phases and there is a period during stance phase where one foot is in initial heel strike and the other is in toe off. This is known as the period of double support (Gage, et al., 1995) and it normally comprises of about 10 percent of the gait cycle.
2.2.2 Terminology of gait
The following parameters are usually measured during gait analysis (Gage, et al., 1995) (Figure 2.3):
- Step length: it is the distance between heel of one foot to the opposite foot heel in stance phase and it is named after the leading foot.
- Stride length or cycle time: it is the distance measured between the same foot’s heel strike in gait cycle
- Cadence: it is the number of steps per unit of time (steps per minute).
- Speed of walking: this refers to the distance covered by the whole body in a given time, measured over one stride or more. It is typically reported in centimeters per second or meters per minute. The instantaneous speed may vary but average speed for the given distance is usually considered (Whittle, 2007).
- Direction of progression: it is the direction in which the subject proceeds along the walkway.
- The walking base (stride width or base support): it is the side to side distance between the lines of two feet, usually measured in millimeters between the midpoints of both heels.
- Toe out (or toe in): it is the angle in degrees between the direction of progression and the line drawn in the middle of the foot
Figure 2.3 Gait Parameters
2.2.3 Center of gravity and the six determinants of gait
The mass of an object is normally distributed equally throughout the parts within, but for study purpose on the effects of applied kinetics it is assumed that the object entire mass is concentrated at a particular point. This is known as center of mass or more popularly, the center of gravity of that particular object. For example, it is understood that the center of mass (GRAVITY) for a symmetrical object must be the geometric center for that object. However for human body it is necessary to find the center of gravity by mathematical calculations as it is irregular and changing posture and shape from time to time. It has been found that the center of gravity of normal human body lies just in front of the S2 vertebra while standing erect (Jacquelin Perry, 1992) and (Baker, 2004).
The normal human walking follows a sine wave (mathematical curve)/ sinusoidal pattern changes in the center of mass in the vertical and Medio-lateral directions along the direction of progression. The maximum height is noted on the vertical plane at mid stance and minimum height is during double support phase. It also noted that there is about 5 cm lateral oscillation of center of mass. (Orendurff et al., 2004) Concluded that with increase in gait speed, the vertical displacement was shown to increase and the Medio-lateral excursion decreased.
Gait cycles analyses the six determinants which are thought to be crucial in reducing the excursion of center of mass of the human body, which helps to minimize the abrupt changes, which would be energy efficient during locomotion. These determinants are pelvic-rotation, pelvic tilt, knee-flexion in stance phase, foot mechanisms, knee mechanisms, and lateral pelvic displacement described by (Saunders JB et al, 1953). Some researchers including (Della Croce U et al, 2001) and (Lelas JL et al., 2003) proposed that only one of the determinant namely foot mechanism played a significant part in reducing the vertical excursion of center of mass. The theory of vertical excursion of center of mass as a means of energy efficiency was not accepted by (Baker, 2004). It was instead proposed, that during double support and single support phases of the gait cycle, energy is mostly conserved by backwards and forwards exchange between potential energy and kinetic energy. Despite of several controversies, the concept of reducing the vertical excursion of the center of mass has been widely accepted as main feature of human walking (Orendurff et al., 2004).
2.3 Kinematics
The joint angular rotations as well as the translation measurement of particular segments or whole body mass during the gait without actually considering forces that cause movements is known as kinematics. This allows comparison between the normal gait and pathological from normal (Sutherland, 2002).
The ultimate scientific purpose of gait analysis is the accuracy of parameter measurement of motion. However, this is a challenging as complex coordinated movements occur in all the joints of the body simultaneously during walking. Since the late 1800s many notable contributions in the field of kinematics by many scientists and clinicians were made as stated by (Sutherland, 2002). Braun and Fischer were the few who contributed as early as in 1889, they applied Geissler tubes to limbs. But Eberhart and Inman in 1947, applied small light bulbs to joints and limbs, and took several photographs of the subject walking in the dark and thus collected data were used to calculate kinematic measurements. However, their methods were time consuming and technically difficult so these methods could be used only for research purpose and not for clinical analysis. Murray in 1960s came up with a remarkable idea and used reflective markers and strips attached over the anatomical locations of the body and the subject’s walk in strobe light was photographed. Kinematic data was derived from the photographs. The drawback of this methodology was the manual method of drawing joint angles and measurements (Sutherland, 2002).
Much more interest was generated in photographic methods of gait analysis as the whole body was included and relationship of individual segment and joint to the trunk was viewed as described by (Sutherland, 2002). Kodak Company (USA) were the first who introduced Vanguard motion analyzer for whole body Gait Analysis. Further developments were done namely by Furnee from Netherland in 1967 introduced automated recording of reflective markers with TV/motion analysis system. Further inspired with motion analysis system, Paul developed a systems which uses two Bolex cine-cameras driven by two synchronous electrical motors. Development of high speed motion capture cameras and with the use of computer programs for processing the collected data was a major breakthrough in the history of modern gait analysis systems. In early 1970s Oxford Metrics Ltd. Company developed the first ever 3 dimensional gait analysis system headed by Morris, Jarret and Herring along with others. Vicon® (derived from video-convertor) was name given to that system. This system( 3 D cameras), picks up reflections from retro reflective markers placed on the subject while walking on a calibrated walkway, and complex computations are made by computer software to produce the kinematic and kinetic data (Sutherland, 2002).
2.4 Kinetics
Kinetics is a branch in physics which deals with the mechanisms that cause actual movements. These are namely ground reaction forces (GRF), joint moments and joint powers of normal gait analysis. Thus, kinetics is the study of forces acting on the joints and the motion segments during gait. As Newton’s 3rd law states, the reaction force from the ground is equal to the forces that the human body applies to the ground or floor while walking (Zatsiorsky, 2002). In recent times, the laboratories measure the force beneath foot during walking with some form of specialized force platform, data thus collected is computed to calculate the joint moments, power and forces and kinematics (Sutherland, 2005).
In the 19th century Carlet and Ampar of France measured forces acting upon the heel and the forefoot with pneumatic pressure gauges to start with. A constraint of this system was that it provided only one-dimensional data. Further Fischer from Germany and Ampar from France improvised enhanced upon Carlet’s work by creating force plate with 3 components using pneumatic gauges. The improvisation continued in this field, Dr. Elftman was able to introduce spring loaded double platform force plate capable of measuring GRF and separating them in to components. Similarly, GRF was further converted into four components using strain gauge on the force plates by Cunningham and Brown. Restrictions about these models for example, such that requirement to calibration, affectability to temperatures and absence of workstations computers for calculations made their clinical utilize challenging.
Major breakthrough was the development of piezo-electric plates by the Kistler® Corporation Switzerland brought an end to the above mentioned problems in force plates. These have now become integral part in the gait laboratories for kinetic measurements. Successful documentation of the kinetics of the individual joints using similar plates was done by Paul in 1967 on human gait (Sutherland, 2005). Force plates using improved strain gauge technology integrated with motion analysis systems are being manufactured by various companies and these are used by laboratories for clinical and research purpose.
2.5 Gait analysis
Analysis of gait was of major interest for the main reason that it improves understanding of normal and abnormal gait through research and other is that it helps clinicians treat a particular problem of the individual (Abboud, 2002; Whittle, 2007). However, in the absence of modern gait labs most clinicians around the world are still relying on functional gait assessment by naked eyes (qualitative analysis) using observational methods (Fish Deanna J & Nielsen, 1993). With the modern tools like high speed cameras(3D/ video), force platforms and electromyography data with computerized workstations, the gait analysis laboratories have brought about a vast prospective into Gait assessment (Quantitative analysis).
2.5.1 Visual gait (Qualitative) analysis
As mentioned in texts, it is a common practice for physicians to perform visual, or more popularly known, observational gait analysis on their patients. As recommended by New York University (Whittle, 2007) on the visual gait analysis, this involves examination of the subject walks on a walkway several times of the gait performed from front, sides and back. In this manner, a number of gait parameters can be observed. However, it is practically impossible to observe multiple body segments and their movements as whole (Kerrigan DC et al, 1998). But, observational gait analysis can help distinguish between simple and obvious forms of gait abnormalities like dropped foot with high stepping gait, painful antalgic gait of the lower limbs, unsteady and toe to heel/ flat foot strike gaits of Parkinsonism and ataxic gait of cerebellar or dorsal column medical conditions.
Drawbacks of observational gait analysis as mentioned by (Whittle, 2007): the technique has intra observer errors as it depends on the skill of the observer. There is no way of keeping the permanent record as it only observational. Humans cannot visualize very details of the gait as it is high speed events, only movements can be observed (not the forces).
Many researchers recommended that some way of recording with video cameras would help the short comings.
2.5.2 Quantitative gait analysis
Most advanced sophisticated systems measure kinematics, kinetics and muscle activity that are the main three components of gait analysis. Further additional data’s can be gained using footswitches (timing of gait cycle) and oxygen consumption monitoring (energy expenditure). Motion analysis systems (like Vicon®) are used for kinematics, force plates for kinetics and multichannel EMG for muscle activity. The effectiveness of quantitative gait analysis is performed prominently in patients with many medical disorders affecting the gait cycle (Gage, 2009; Sutherland, 2002). Similarly, physiatric treatments like stretching, strengthening, bracing, functional electrical stimulation and intramuscular neurolytic techniques can be decided upon using this modality (Azam et al, 2008; Kerrigan DC et al, 1998).
2.6 Gait speed
Gait speed is a most reliable, fast and inexpensive way of measuring functional well-being with well acknowledged prognostic value for major health related outcomes. Multiple studies have documented gait speed in healthy, community-dwelling older people. Gait speed is “almost the perfect measure.” A trustworthy, widely accepted, sensitive and specific measure. Self-selected gait speed is also coined as gait velocity, which associates with functional ability and balance confidence of an individual. It has the potential to predict future health status and functional decline including hospitalization, discharge location, and mortality. Gait speed replicates both functional and physiological changes, is a selective factor in determining potential for rehabilitation and aids in prediction of falls and fear of falling. Furthermore, progression of gait speed has been linked to clinical significant changes in quality of life and in home and community walking behavior. Due to its ease of use and psychometric properties (Fritz et al., 2009). Gait speed has not been assessed in a standardized fashion. (James E. Graham et al., 2008) Reported that clinical estimations of walking velocity are not conducted uniformly and that common methodologic factors might influence the clinical understanding of gait performances. Marked variations have been described in gait speed test methodology within both clinical practice and published research. During a laboratory-based collection of over ground gait data, for both clinical and research purposes, participants will typically complete a series of repeated, individual short trials that involve walking through a motion capture volume. Each trial begins with a gait initiation, contains a limited number of strides during which data are collected, and finishes with a termination. Even though this is clearly not a typical, everyday walking scenario, the discrete measurements obtained are considered to be characteristic of individuals’ typical walking. While short-distance walking speed is indicative of functional independence within the home, one of the primary criticisms of these clinic-/lab-based measures of walking speed is that relative performance may not be characteristic of independence within the community. However, walking speed, a global descriptor of gait quality that can affect joint kinematics and kinetics during discrete trials, compared to continuous walking. Community ambulation typically requires an individual to not only differentiate and control gait speed for short distances, but also sustain it for extended periods of walking. (Peter A. Altenburger et al, 2013) Suggested Functional walk tests, which are commonly used to assess functional capacity or endurance under such conditions, in addition to assessing gait speed. These tests differ from discrete gait speed tests, in that they require sustained walking over an extended period of time. Performance is directly related to the person’s self-selected gait speed in that the faster the speed and the better the ability to sustain it, the farther one can walk, indicating a better level of endurance.
2.7 Previous research
Not many research has been found in the literature regarding gait parameters variability between short walking trails and continuous walking trails. As short walking done in the labs are not the natural gait walking in day today life. Research has been carried out in IMAR Dundee between short walking and continuous walking trails to compare which gives more realistic gait parameters.
Comparison of the 2-, 6-, and 12-minute walk tests in patients with stroke was carried out by (Marc Kosak & Teresa Smith, 2005) tests showed acceptable inter- and intrarater reliability and high interest correlations when used for the assessment of walking following stroke. The SRM statistic indicates that the 12-minute walk test is the most responsive to change.
(James E. Graham et al., 2008) conducted a systematic review of the research literature and describe how tests of walking speed are used and reported. The study highlight the different approaches used in the assessment of walking speed and examine the extent test methodologies vary. They proposed few tentative recommendations regarding the development of a standardised protocols to access walking speed and hoped this would stimulate debate and further studies into appropriate design of walking speed assessments
(Kharma C.Foucher et al., 2010) Studied on Differences in Preferred Walking Speeds in a Gait Laboratory Compared with the Real World after Total Hip. Results were that Laboratory speeds were significantly faster than habitual speeds in all groups (P_.001), but the 2 correlated significantly but Concluded that although subjects may exaggerate walking speeds in laboratory settings, laboratory-based data accurately reflect real-world activity.
(Hiroshi Mitoma et al., 2014) assessed the outcome of A Newly Developed Wearable Device for Continuous Measurement of Gait- Induced Accelerations in Daily Activities. They assumed that the 10-m walking is short and reflects only one aspect of daily living and the results could be affected by emotional stress. To examine the step cycles and forces for step-in and kick off, which are directly controlled by a complex neural circuitry, during daily walking and over a long period of time, the exact measurements of gait-induced accelerations from other movements can be noted. The results suggest that Analysis of voluntary gait in daily life could enhance our understanding of the pathomechanisms of gait disorders.
(Fabio A.Storm et al., 2016) evaluated the Gait event detection in laboratory and real life settings: Accuracy of ankle and waist sensor based methods. Two methods for free living gait event detection using inertial sensors. The shank method was overall more accurate than the waist method. Accuracy of the methods in an urban environment was comparable to scripted walking. Results were encouraging for the application of these methods in free living gait.
(A. Nait Aicha et al., 2017) stated that the disadvantage of the clinical assessments is that the tests are usually carried out over a short period of time in an unnatural setting. For assessments in home settings, measurements have to be carried out by a therapist in the home, which is time consuming and therefore expensive. The measurements may also be subjective to the therapist taking the tests. Continuous domestic monitoring may provide a clearer and more objective picture of a person’s mobility. This study shows the potential of continuously monitoring the indoor gait velocity of older adults living alone using a simple sensor network and shown that unconstrained behavior leads to a multimodal distribution of path durations, as walking is interwoven with other activities.
(Thomas KS et al., 2017) studied on the impact of speed and time on gait dynamics. The aims of this study was to assess differences in gait dynamics for young healthy adults walking at preferred (PWS) and slower speeds (90% and 80% PWS), and determine if any changes occurred during 30 min of continuous walking. The results revealed notable differences in many spatiotemporal parameters with speed, even though subjects walked at speeds only 10 or 20% slower than preferred.
A Comparison of Self-Selected Walking Speeds and Walking Speed Variability When Data Are Collected during Repeated Discrete Trials and During Continuous Walking by (Brown MJ et al., 2017) conducted the study with 25 patients. The conclusion was Walking speed was significantly higher during the discrete trials compared to the continuous trials (p < .001), but there were no significant differences in walking speed variability between the conditions. The results suggest that choice of gait protocol may affect results where variables are sensitive to walking speed.
Thus, it is clear from the above studies that differences exist between continuous walking trails and short walking trails. Therefore, considerations to have taken in mind before analyzing the gait parameters on the type of walking trails to be used in future.
CHAPTER 3
3. methods and materials
This analytic study was carried out between January and March 2018 in the Gait Laboratory at the Institute of Motion Analysis and Research (IMAR), based at the Tayside Orthopaedic and Rehabilitation Technology (TORT) Centre, Ninewells Hospital and Medical School, Dundee, UK. University of Dundee Ethics Committee approval was obtained before the commencement of the study (Appendix 1). Following this, subjects were recruited using electronic and verbal communications (Appendix 2).
3.1 Vicon® camera system
For the assessment of Gait analysis, 14 of these cameras (8 MX T-20 and 6 vero-V1), installed in the Gait Laboratory at the IMAR were used for this study (Figure 3.1). The cameras are manufactured by Vicon® Motion Systems Oxford, and are state-of-the-art three-dimensional high resolution camera system capable of capturing 2 megapixel images with the speed of 500 frames per second (Vicon®, 2017). The cameras have diodes surrounding their lenses which emit strobe (infra-red) light (Figure 3.2). This light is reflected back in to the camera lens by the retro-reflective markers placed on the subject’s body. These markers are spherical glass balls of different diameters covered by a protective film (Figure 3.2). Additional markers mounted on 10 centimetre wand attached to a metal base (wand markers) are applied on the lower thigh and the lower leg (Figure 3.2). These wand markers form a part of the limb segment that helps to identify the plane of the movements and joint centres (IMAR, 2003).
Filters fitted onto the camera are designed in a way to allow only the infra-red light reflected back by the markers to pass through the lens omitting all other light sources. A light sensitive plate placed behind the lens captures the infra-red light and converts it into a digital signal.
Figure 3.1 Gait Laboratory at IMAR (MX T-20 and Vero V1 Cameras and Force Plates installed)
The signals are then fed into a software program called Nexus® (version 2.6.1) running on a powerful computer hardware, which converts these two-dimensional data into three-dimensional data (Vicon®, 2017). The co-ordinates of the markers are used to find the location of underlying bones and joints. Larger diameter markers are more accurate and precise in providing data (Windolf M et al., 2008). Another program called Polygon® (Vicon®) is used further to analyze and reports the data.
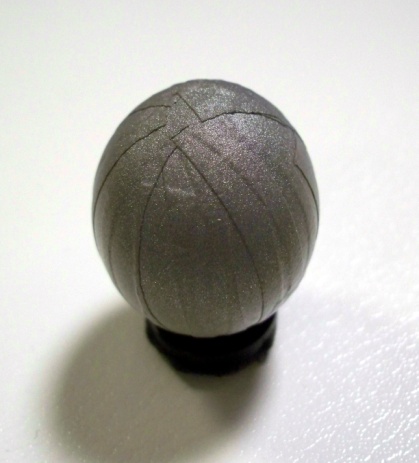
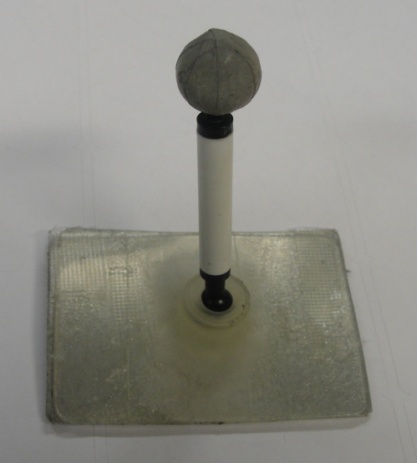
Figure 3.2Vicon® MX-T20 and Vero-V1 Cameras, Marker and Wand Marker
3.2 Force Plates
Four force plates (Kistler® 19281) were fixed and flushed with the floor in the centre of the walkway at the Gait Laboratory (Figure 3.1). The plates were placed slightly offset from one another allowing each to be hit by alternate foot during normal gait. Strain gauges present in the force plate measure the ground reaction forces and transmit them to the Vicon® Ultranet box using six channel output and an amplifier. They measure three-dimensional forces in X, Y, and Z planes.
3.3 Control devices
The hardware used in this study comprised of a network of capture and control devices, two MX Ultranet boxes and a personal computer. Capture and control devices (Figure 3.3) collect analogue data from the force plates and link all the hardware. One Ultranet box controls the cameras and the other provides interface between the force plates, the cameras and the personal computer and thus transmits raw data collected. A personal computer was equipped with the software (Nexus 2.6.1) to analyse and present the data.
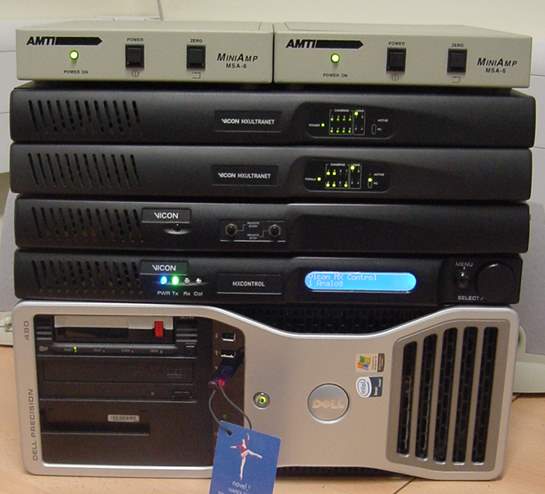
Figure 3.3 Control devices
3.4 Laboratory Preparation
MX-T20 (6 cameras) and Vero-V1 (8 cameras) were fixed in the laboratory. They were aligned facing the walk-way at the centre which is the ‘capture volume’. Four force platforms (Kistler®) located in the centre of the floor forms the origin of the capture volume. The floor was marked with different coloured tapes on either end of the walk-way. The subject is then made to walk from a particular coloured tape accurately hitting the force plates during each short walk trials.
3.5 Subject Preparation
Healthy male and female volunteers of the age group 18 to 55, having no gait pathologies were enrolled for this study. They were provided with an information sheet (Appendix 3) regarding the study. They were also explained orally regarding the procedure. At this stage any of their queries were answered. An informed written consent (Appendix 4) was taken and the subjects were informed that they were free to leave the trial at any moment they desire. In preparation of the trials, subjects were asked to wear shorts and not to wear any footwear. Anthropometric measurements were later taken to feed the data in Nexus® software. It included weight, height, inter antero-superior iliac spine (ASIS) distance, leg length from ASIS to medial malleolus, knee and ankle width using callipers (all in millimetres). Both limbs were measured separately.
3.5.1 Marker placement and Alignment
Markers were placed on the subjects using IMAR plug-in Gait model maker placement (IMAR, 2003). It included application of twenty retro-reflective markers and four wand markers over the lower limbs. After making the subjects to stand, double sided sticky tape markers were applied on the following bony landmarks: both ASIS, both postero-superior iliac spines (PSIS), lateral and medial epicondyles of both femori, both lateral and medial malleoli, dorsum of both feet between 2nd and 3rd metatarsal heads and lastly both heels. Four wand-based markers were placed, each on lower lateral thigh (to avoid the arm swing) and lower lateral leg (to avoid gastrocnemius muscle bulk) (Figure 3.4).
.
Figure 3.4 Marker Placements and their Labels
Each set of three markers form one motion segment. Dorsum of foot marker, lateral malleolar marker and the heel marker form the foot segment. Lateral malleolus, shank and the lateral epicondyle markers become the leg segment and the lateral epicondyle, thigh and ASIS markers become the thigh segment. Wand markers are movable in all directions thus helping in the alignment. Foot and heel markers were also applied in an alignment, such that, they were in one line and at the same level from the floor. Once the alignment of the markers was done, the subjects were ready for the trial.
3.6 Capturing the Data
A data base was created in the Nexus® programme in the personal computer under the title of this study. The first four letters of the subject’s initials were used to create subject folder. Since this study involved examination of the gait twice (Continuous and short walks), First and second sessions (S1 and S2) were created in each subject’s folder. The data capture began once the set up was in line with the protocol. A practice run trial was given to the subjects in which the subject was asked to walk as normally as possible without glancing at the force plates. The colour of the tapes on the floor were chosen appropriately coloured tape after this practice trial during which the subject hit the force plates naturally.
3.6.1 Static Data
The static trial was carried out with the subject standing on the force plate with ‘T’ pose (Figure 3.5). Data were captured using the Nexus® under ‘static, no movie’ trial type.
3.6.2 Dynamic Data
Trial type was then changed to ‘capture, no movie’ in which the subject had to begin walking (short walk) from the pre-selected coloured tape on the floor, through the capture volume. Four good trials in which at least two force plates were accurately hit by the subject’s feet were recorded. The subject was then made to walk continuously for about 15 minutes in the pre marked figure of “8” area where the subject walks the catchment volume area twice in the figure of “8” and the gait parameters were recorded accordingly. Later the subjects were asked to walk a predetermined distance in the community with normal speed for the assessment of time taken to cover the distance at normal speed.
Figure 3.5 Static and Dynamic trials
After the data capture was completed, markers were removed from the subject and any queries were answered. At the end of both sessions, the subject was given a feedback form along with an envelope addressed to the Secretary Orthopaedic Department TORT Centre. The same process was carried out for all the subjects.
3.7 Data Processing
After collecting the data, processing was done for each subject. The Nexus® software allows labelling of the markers and the gait cycle events. Figures 3.4 and 3.5 illustrates the labelling on the subject. Gait cycle events that were labelled: right heel strike, left heel strike, right toe off, right heel strike, left toe off and left heel strike consecutively. The events were chosen looking at the appearance and disappearance of GRF arrows during the cycle. The events outside the force plate had to be labelled consistently and carefully because of difficult definition of the same.
Following labelling, a pipeline function was created and ran within the Nexus® software. The particular Vicon® plug-in-gait model calculates and reconstructs the centres of position of Hip, Knee and Ankle joints using three-dimensional marker data and the anthropometric measurements fed in the software. Joint angles in various planes (kinematics) and the joint forces, moments and powers (kinetics) were then calculated.
The processed data were then plotted to graphs by the senior researcher in IMAR using an in-house programme. Any differences or variations were thus, identified and further assessed by statistical analysis and reported.
3.8 Statistical Analysis
SPSS® (version 21) software was used here to determine statistically significant differences between the data obtained from both the sessions of all the subjects. The significant level (p) was set at 0.05. Paired-sample t-test was done to derive mean, standard deviation (SD) and standard error of mean. Coefficient of Repeatability (CR) adopted by the British Standard Institution (BSI), as described by Bland and Altman (1986) was calculated using differences of mean and their SD. The coefficient of repeatability is twice the standard deviation of differences between mean. In the case of repeated measurements in the same subjects, it is
2SD2. Lower the CR value, higher the repetition.
Cite This Work
To export a reference to this article please select a referencing stye below:
Related Services
View all


Related Content
All TagsContent relating to: "Physiotherapy"
Physiotherapy is the practice of targeted exercise and movement to provide rehabilitation and restore or improve function and correct movement following injury, illness, or disability. Physiotherapy can also help to maintain health and prevent future debilitation.
Related Articles

DMCA / Removal Request
If you are the original writer of this dissertation and no longer wish to have your work published on the UKDiss.com website then please: