Life Cycle Analysis of Fish Products Emphasis on Fish Waste
Info: 16392 words (66 pages) Dissertation
Published: 10th Dec 2019
Tagged: Food and Nutrition
LIFE CYCLE ANALYSIS OF FISH PRODUCTS EMPHASIS ON FISH WASTE
The objectives of this research were to classify the wastes generated during the manufacturing processes of fish products and evaluate the environmental impacts of the fish wastes through life cycle analysis (LCA) as well as to characterize the potential utilization of fish wastes as protein-based thermoplastics. Production of canned fish products from Protigam Food Industries Sdn. Bhd. was investigated by following four steps in LCA; (1) goal and scope definition, (2) life cycle inventory (LCI) analysis, (3) life cycle impact assessment (LCIA) and (4) interpretation of result. The goal of this work is ‘cradle-to-grave’ life cycle of canned fish products whereas the scope is the functional unit of every 1 tonne of raw fish entering the factory. The LCI analysis was carried out by obtaining the inventory data of the whole process flow as well as the inputs and outputs of each subsystem in the manufacturing process. Then, LCIA was performed by identifying the related impact categories for the canned fish products, followed by calculation of the values for those related impact categories. The values were then normalized with the functional unit. It was shown that for every 1 tonne of raw fish entering the factory, about 0.22 tonnes of municipal solid waste was produced, 1.27 kg eq PO4 in eutrophication potential was increased and 1383.6 kWh of electricity was consumed. Lastly, the results were interpreted through contribution analysis where the process of butchering, icing and retorting were identified as the biggest contributor for impact categories of municipal solid wastes, eutrophication potential and energy consumption respectively. On the other hand, the result of Kjeldahl analysis showed that fish waste powder has about 16% protein content, making it a suitable candidate for protein based thermoplastics.
CHAPTER 1
INTRODUCTION
The production of fish products is increasing from year to year due to the high demand of global fish market. FAO (2016) reported that the growth of global fish supply is increasing at an annual rate of 3.2% from 1950 to 2014. In Malaysia, fish are generally processed into different forms such as frozen, cured and dried fish to meet the market demand (Huda, 2012). For example, the biggest percentage of fish products manufactured in Penang and Perak is processed fish products, including fish balls, fish crackers and fish cakes. However, the fish processing industry also contributes to the high consumption of electricity and generation of huge amount of wastes such as heads, guts and skins as well as wastes effluents (Henriksson, 2011). Hence, there is a need to evaluate the environmental impacts of fish processing industry in order to find solutions to improve the environmental performances of the industry.
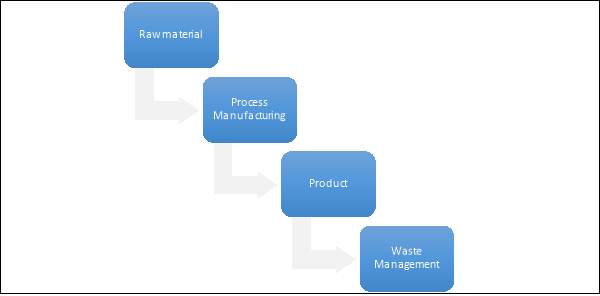
In this work, Life Cycle Analysis (LCA) was chosen to be the environmental assessment tool. LCA is a quantitative method to assess the environmental performance throughout the entire life cycle of a product, process or activity in order to identify the best environmental option of waste treatment (Angelo et al., 2017). The LCA should include the entire product life cycle, material and energy acquisition, input material and energy during manufacturing, product outputs, generation of wastes, use of end products and waste management.
Wastes from fish processing industry are becoming the sources of pollution to the receiving environment where these wastes are discharged. According to Islam et al. (2004), the improper discharge of fish processing wastes had contributed to the huge increase in biological oxygen demand (BOD), chemical oxygen demand (COD), total suspended solids (TSS) and fat-oil-grease (FOG). The increase in these environmental parameters will lead to the low oxygen level in the water and contamination of water with foreign particles that can pose great threat to the aquatic animals and the people who use the polluted water.
There are several different waste management techniques used in different countries such as incineration, composting and pyrolysis. According to Ishak (2002), the waste management technique in Malaysia is end-of-pipe treatment. The end-of-pipe treatment is a traditional waste management approach which is applied after the processes to prevent the release of waste and by-products into the environment. There are a few disadvantages of this technique such as high cost of waste treatment as well as increases the environment burdens. Hence, there is a need for waste management technique applied in Malaysia to be updated so the new waste management technique can reduce the environment loads and lower the waste treatment cost.
One of the solutions for disposal of fish processing wastes is by utilizing the fish wastes in the productions of value-added products. Ghaly et al. (2013) reported the utilization of fish wastes in the production of fish silage, fish meal and fish sauces. The fish silage is produced from the liquefaction of fish tissues while the fish meal is prepared in powder form from fish filleting wastes. Besides, the fish sauce is produced from the salt fermentation of small pelagic fish by-products. Therefore, more research works on the utilizations of fish processing wastes should be carried out in order to identify more opportunities of income for the industry as well as to reduce the pollution.
The highlight of this project is to increase awareness and knowledge on the environmental impacts of fish wastes while the potential utilizations of fish wastes could aid in creating new industry sector which can leads to increase in job opportunities and new income for the nation.
Currently, fish processing industry generates huge amount of wastes that contributes to the increasing environmental pollutions. However, there are limited studies on the waste identification, management and impact assessment on the wastes from fish processing industry in Malaysia. This limitation has restricted the measurement of cleaner production technologies are seen as directly reducing environmentally harmful impacts during the production process. The end-of-pipe treatment technique which is normally implemented as a last stage of a process before the stream of air, water, waste, and product are disposed or delivered is seen as ineffective method if the demand in the fish products continue to rise in the future as the high cost of end-of-pipe treatment has encouraged the activities of illegal discarding of wastes.
- To evaluate the ‘cradle-to-grave’ life cycle of fish products through LCA.
- To identify classification of wastes produced during manufacturing processes of fish product.
- To evaluate the environmental impacts of fish processing wastes.
- To evaluate the protein content in fish waste to be used as a starting material for protein based thermoplastics.
This thesis basically consists of five chapters.
Chapter 1 provides the overview of the research and a brief literature survey of the previous and relevant work. The problem statement and the research objectives have also been stated and described in this chapter.
Chapter 2 highlights the detailed literature review of previous and relevant works about global fish consumption, production of fish products, fish processing industries in Penang and Perak, energy usage and processing wastes of fish processing industry, industrial waste, environmental impacts of fish wastes, life cycle analysis (LCA), current and potential utilizations of fish wastes as well as fish protein.
Chapter 3 presents the raw materials, methods and equipment used in the present work, which are Life Cycle Analysis (LCA) and Kjedahl Analysis. The procedures, characterization method and data collection techniques as well as data analysis methods have also been described in details.
Chapter 4 gives the interpretation and discussion of the experimental results of the research work. The results of LCA, including goal and scope definition, life cycle inventory (LCI), life cycle impact assessment (LCIA) and interpretation of result, waste treatment approach for fish product manufacturing as well as the characterization of composition of fish wastes have been discussed intensively in this chapter.
Chapter 5 presents the significance of the results and the summary of the research study. The recommendations for the future studies in the related research are included in this chapter.
CHAPTER 2
LITERATURE REVIEW
2.1 Global Fish Consumption and Production of Fish Products
Over the last 50 years, the production of seafood and fish products clearly reflected the global market demand. FAO (2016) reported that the growth in the global supply of fish products for human consumption has outpaced population growth by increasing at an average annual rate of 3.2 percent as shown in Figure 2.1. The statistic implies that the world seafood and fish products production will continue to rise in the future due to increasing demand of the global market.
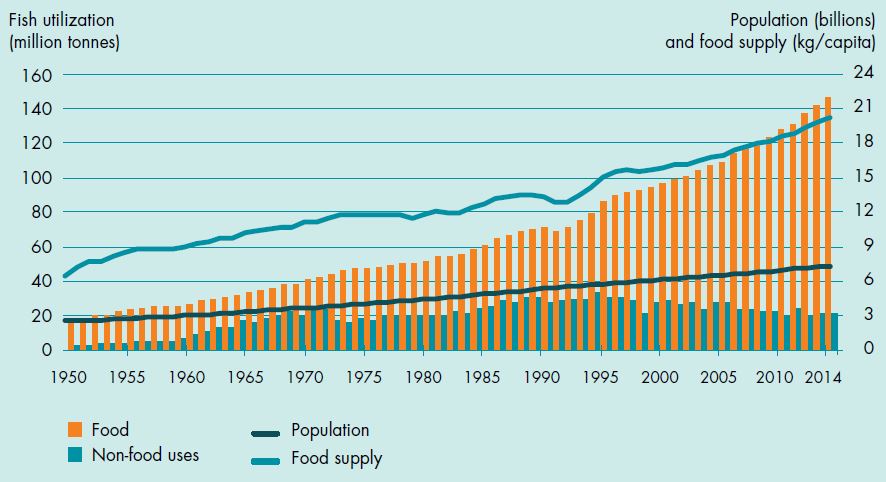
Figure 2.1: The plot of world fish utilization and supply (FAO, 2016).
FAOSTAT (2015) ranked Malaysia as the top seafood eating country in South East Asia with an average of annual per-capita consumption of 59 kg between 2000 and 2011. This indicates that for each Malaysian, the average annual fish consumption is 59 kg which is much higher as compared to that of world fish consumption per capita (21.4 kg). The statistics coincides with the increase in average monthly Malaysian household expenditures between 1993/94 (RM53.00) and 2009/2010 (RM98.00) (Tan et al. 2015). The data indicates that the rate of fish consumption in Malaysia increases with increase in income, the phenomenon will contributes to the increase in fish consumption rate per capita as the income of Malaysian is expected to increase in the future. Hence, the production of fish wastes is predicted to increase with increase in rate of fish consumption.
The huge market demand for fish products indirectly boost the growth of fish processing industry. According to the report of FAO (2016), only 67 million tonnes of fish for direct human consumption was in the form of live, fresh or chilled fish, representing 46% of the total amount of fish consumed by the world population in the year. The remaining 54% was processed in different forms such as cured fish (17 million tonnes), prepared and preserved fish (19 million tonnes) and frozen fish (44 million tonnes).
The trend in the world production of fish products is also reflected in the production of fish products in Malaysia. Huda (2012) reported that around 1,064,422 tons of marine fish that was landed in Peninsular Malaysia in the year of 2009, 63% of the landed marine fish are utilized for direct human consumption in the form of fresh fish while the rest are processed into different forms, which are fish meal (20%), cured (11%), frozen (1%) and disposal (5%). There are a few categories for cured fish, including salted, dried or smoked products (28%), fermented products (28%) and boiled or steamed products (5%) as well as other products like fish balls and fish crackers (39%).
The extensive growth in fish processing industry in Malaysia is observed in recent years. In 2014, there are huge amount of processed fish products was exported to other countries as well as imported into Malaysia (DOF, 2014). Figure 2.2 and Figure 2.3 illustrate the percentages of different exported and imported processed fisheries commodities in Year 2014 respectively. From Figure 2.2 and Figure 2.3, the fish products which are dried, salted or in brine but not smoked were identified as the most significant contributor of both exported and imported processed fisheries commodities with portions of 42% and 88% respectively. The phenomenon is probably due to the significant usage of these products in the daily meals of Malaysians.
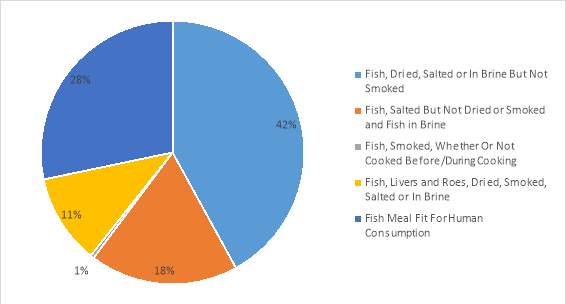
Figure 2.2: Percentages of different exported processed fisheries commodities in 2014 (DOF, 2014)
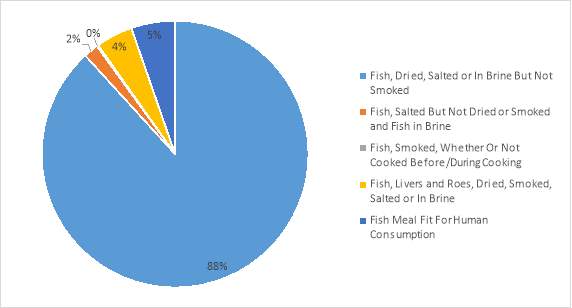
Figure 2.3: Percentages of different imported processed fisheries commodities in 2014 (DOF, 2014).
Fish consists of different components such as fins, backbone, fillet, head, skin, roe, gut and liver as shown in Figure 2.4. Usually, fillet is the major fish part consumed in human diet as fillet contains high nutritional values of protein content and omega 3 and 6 series lipids as well as few percent of saturated fat and cholesterol (Nova et al., 2005; River et al., 2016). Table 2.1 listed the average composition of fish.
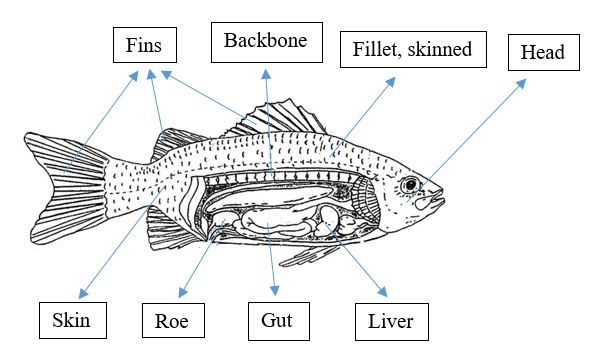
Figure 2.4: Various components of fish.
Table 2.1: Average composition of fish (Waterman, 2001).
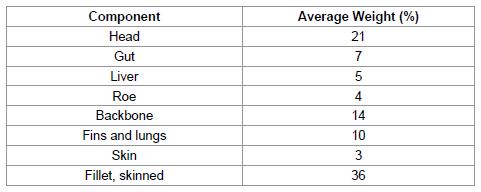
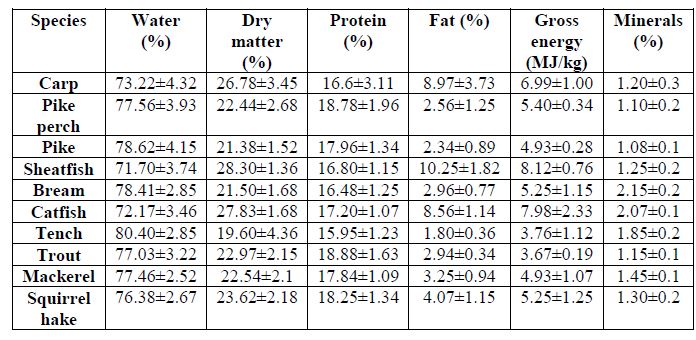
From Table 2.1, it was shown that the skinned fillet is found to be the most significant contributor for the weight of a fish. However, different fish species shows different properties. Bud et al. (2008) presented the composition of fish fillet for various fish species in Table 2.2. The main element of the composition of fish fillet is the water content as water content contributes more than 70% of the composition of fish fillet.
Table 2.2: Composition of fish fillet for various fish species (Bud et al. 2008).
Other than fish fillet, all other non-edible fish parts are categorized as fish wastes. Esteban et al. (2007) listed the composition of fish waste as shown in Table 2.3. The crude protein is identified as the main component of fish waste as crude protein make up about 60% of the composition of fish waste.
Table 2.3: The composition of fish waste (Esteban et al., 2007)
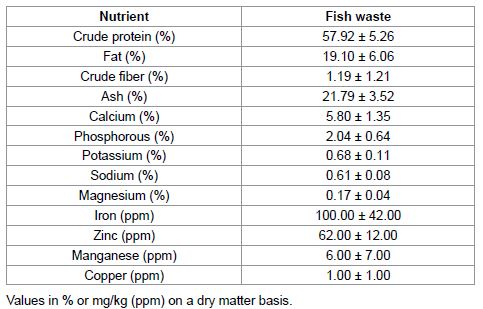
However, the above composition of fish waste cannot be employed for all kinds of fish as each type of fish has its own specific chemical composition that produces wastes.
2.3 Fish Processing Industries in Penang and Perak
To narrow down the scope of research area focusing the nearby industry, fish processing industries in Penang and Perak were considered. In Penang and Perak, the fish are processed into different forms to maintain the quality of fish when the end products are delivered to the customers. The categories of fish products produced includes salted product, dried product, cooked product, frozen product, processed product and the other products. The percentages of fish processing industry manufacturers in Penang and Perak are illustrated in Figure 2.5 and Figure 2.6 respectively.
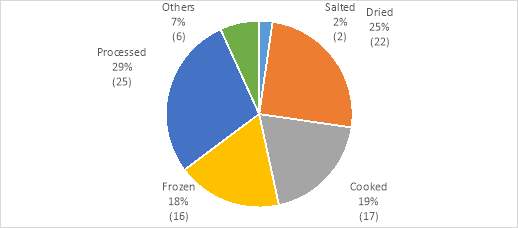
Figure 2.5: Percentages of fish processing industry manufacturers for different fish products in Penang, Malaysia (DOF, 2016).
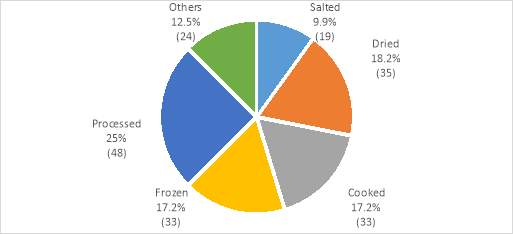
Figure 2.6: Percentages of fish processing industry manufacturers for different fish products in Perak, Malaysia (DOF, 2016).
Figure 2.5 and Figure 2.6 show that the biggest percentages of fish products manufacturers are processed fish products manufacturers. The processed fish products are generally composed of fish ball, fish cake, fish crackers and other processed food from fish which the end products are no longer in the form of fish. Other than processed fish products, dried fish products, cooked fish products and frozen fish products also contribute to the fish processing industries. The examples of cooked fish products are boiled fish and ‘Belacan’. This indicates that the multivariate of sectors of fish processing industry in Malaysia. So far, there is limited data on the waste produced from fish processing industries. However, by looking at the demand, it is not hard to imagine the great amount of fish wastes generated from the various sectors of fish processing industry in Penang and Perak.
2.4 Energy Usage and Wastes Generated from Fish Processing Industry
The fish processing industry contributes to the part of the energy consumption in fish industry. Figure 2.7 illustrates the basic production processes in the fish industry. Fishing phase is the phase which the activities of catching fish are carried out. From Figure 2.7, the fishing phase contributes to the largest part of energy consumption as it involves high consumption of fuel as fishing activities require the use of fishing boats and gears (Henriksson, 2011). Besides, about 25% of energy consumption in the fish industry is due to the transportation of fish products for marketing. Vans, lorries and other transportation vehicles are needed to transport the fish products to the markets such as wet markets, supermarkets and night markets and hence high rate of fuel consumption is involved. The processing of fish products only contributes about 10% of the total energy consumption in fish industry. The processing of fish products requires the use of machineries and motors where high electrical power is used. Although the energy consumption for the production of fish products is not significant compared to fishing phase and marketing phase, the portion is expected to be bigger in the future as the future processing will involve a very high production rate of fish products which will then involve higher consumption of electricity.
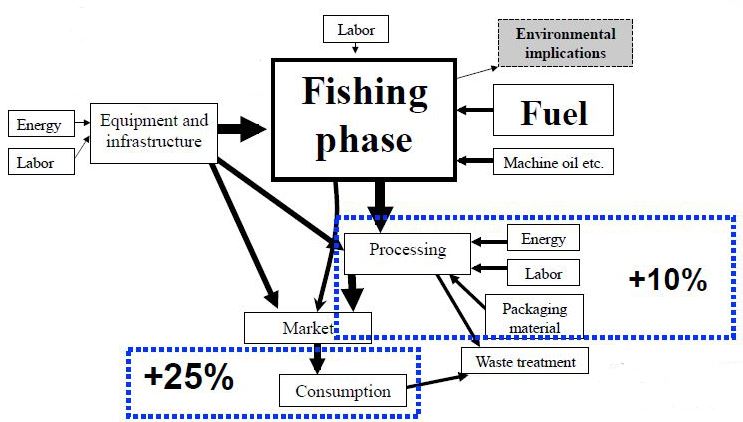
Figure 2.7: Flow chart of the production processes in fisheries with the energy consuming steps identified (Henriksson, 2011).
Ghaly et al. (2013) explained the steps of fish processing in the industry which involves stunning, grading, slime removal, deheading, washing, scaling, gutting, cutting of fins, meat bone separation and steaks as well as filleting. Processing of fish usually begins with the step of stunning. Stunning can provide sufficient movements to rupture the bones and blood vessel. The next step is grading where fish is sorted by species and size, followed by slime removal through continuous washing. The following step is scaling step which removes the scales from the fish to keep the fish fresh. After that, the fish will be washed to clean and remove the accumulated bacteria on the fish. Then, the inedible fish head and internal organs as well as fins will be removed during the consecutive deheading, gutting and fins cutting steps. Finally, filleting step will be carried out to get trimmed fillet and the meat will be removed from skin, scales and bones during process of meat bone separation. Figure 2.8 shows the typical sequence of fish processing steps in the fish processing industry.
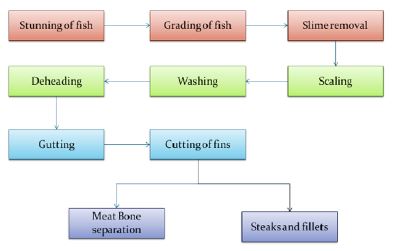
Figure 2.8: Fish processing steps (Ghaly et al., 2013).
During these steps, significant amount of wastes (20% – 80%) was generated depending upon the level of processing and type of fish. Ghaly et al. (2013) explained that there was an important amount of waste streams occurs mainly in the operations of scaling, deheading, gutting and fins cutting as well as meat bone separation. In these operations, solid fish wastes such as head, tails, skin, gut, fins and frames as well as the waste effluents (mainly water and oils) were generated. Okereke & Onunkwo (2014) described the processing steps of fish crackers in the fish processing industry. The deheading, gutting and deboning as well as washing process in the production of fish crackers were identified to be the main processes which generated wastes such as bones, guts and fins as well as huge volume of waste effluents. However, at present, the general research in energy consumption and processing wastes of fish products is still in its infancy. Further research study is necessary in order to recognize the main contributor of high energy consumption and generation of huge amount of fish processing wastes in the industry.
The wastes generated in the industries such as fish processing industries are generally categorised as industrial wastes. The specific meaning of industrial waste is that it is the unusable or rejected products or by-products of industrial processes. In Malaysia, the Department of Environment (DOE) has specified the definition of industrial waste. DOE characterized industrial waste as water from factories, processing effluents, slurry and sawdust (Ishak, 2002). Mohamed (2009) categorized the industrial wastes in Malaysia into two types which are solid wastes and hazardous wastes. In terms of industrial wastes, solid wastes include the solid, liquid, semi-solid or containerized gaseous wastes generated by industrial processes, activities or by-products which do not cause adverse effects to the human health and environment whereas hazardous wastes incorporate any substance endorsed to be scheduled wastes, or any matter either in solid, semi-solid, liquid, gas or vapour form which is released or emitted to the environment in such amount, volume or manner that can cause environmental pollution.
2.5.1 Current Industrial Waste Management Approach in Malaysia
Ishak (2002) reported that Malaysia is the one of the nations in South East Asia which has applied end-of-pipe treatment as main industrial waste management approach for a long time. The end-of-pipe technology is the traditional approach for industrial waste management, which is usually implemented as a last stage of a process to prevent the delivery and disposal of stream of wastes and by-products into the environment. Mohamed (2009) claimed that this end-of-pipe approach had generating numerous environmental issues such as illegal discarding of waste. The uncontrolled dumping of industrial wastes pose great threat to human health and environment. Table 2.4 listed the important incidents of illegal dumping of industrial waste in Malaysia.
Table 2.4: Reported Incidents of Hazardous Wastes Illegal Disposals in Malaysia (Mohamed, 2009).
| Year | Location | Amount and Type of Wastes | Company |
| 1989 | Pantai Remis, Perak | 1,500 tonnes of toxic wastes | Unknown |
| 1993 | Bukit Merah, Perak | Radioactive wastes | Asian Rare Earth Plant, Mitsubishi Kasei. |
| 1995 | Pangkor Island, Perak | Forty-one drums of highly
toxic potassium cyanide |
Unknown |
| 1995 | Penang Island | 28 drums of
trichiorofluoromethane |
Unknown |
| 2001 | Ulu Tiram, Johor | 1,000 tonnes of metal ashes | Foreign-based smelting
company |
| 2003 | Ijok, Selangor | 500 drums of paint sludge and glue | Unknown |
For fish processing industries, the main source of wastes is fish waste. Typically, fish waste may be disposed of in three ways depending on the local circumstances:
- Landfill – the waste may be buried underground in pits at least two metres deep and covered with a minimum of 200 mm of earth to prevent infestation with flies and other pests and to accelerate the rotting process. However, this method is not suitable when groundwater tables are close to the surface.
- Return to sea – dumps it a long distance offshore. Disposal of fish wastes can be done in the offshore ecosystems from which the fish are caught. The fish waste disposed in the offshore ecosystems should not cause any water quality problems in open waters.
- Utilized as by-products – as value-added products in various fields. Currently, the solid fish wastes can be utilized in the production of fish meal, fish sauce and fish silage. Besides, there are potential utilizations of fish wastes in other applications such as hydroxyapatite product and protein-based thermoplastics.
Among the three disposal methods, landfill is the most widely used waste management method in Malaysia due to the practice of end-of-pipe treatment (Lim et al., 2016). However, instead of solving the waste disposal problems, end-of-pipe treatment transfers the problem elsewhere. There are some other problems arise with the application of end-of-pipe treatment, including the elevated cost of waste treatment, management and disposal, on-site waste control and monitoring. The cost incurred for end-of-pipe treatment is a significant financial burden for the company. Furthermore, the practice of landfilling in end-of-pipe treatment requires some on-site spaces for the storage of the wastes, which involves exorbitant cost and which rather be utilized for profitable operation (Ishak, 2002). The development and enforcement of end-of-pipe control has proven to be very costly, and yet achieving the expected outcome is not guaranteed. Hence, the implementation of end-of-pipe treatment is accompanying with high non-production capital costs and on-going operational costs. The high cost incurred for end-of-pipe treatment has encouraged the illegal discarding of industrial wastes, resulting in various kinds of environmental pollutions such as land pollution and water pollution.
Nevertheless, the research work for investigating the waste management approach applied in various industries of Malaysia is still considered very limited. Therefore, it is essential to carry out research work on waste management approach in fish processing industry of Malaysia which do not gain much attention of researchers in previous works.
2.6 Environmental Impact of Fish Wastes
Due to the fact that end-of-pipe treatment approach has contributing to the activities of illegal discarding of wastes, the fish waste and processing effluents are becoming the hazards to the environment, especially on the receiving coastal and marine environments where these waste effluents are discharged illegally. Islam et al. (2004) studied on waste loading and discharging of shrimp and fish processing effluents. He discovered that fish processing plant produced heavy loads of wastes with complex mixture of various substances such as fish scales, shells, muscles, soluble protein and fats, chemical and organic substances. The increasing production of these inedible fish wastes and by-products poses a great threat to the environment because most of these wastes were discharged into the nearby coastal waters through discharging channel. The report also suggested that fish waste and shrimp processing effluents are very high in biological oxygen demand (BOD), chemical oxygen demand (COD), total suspended solids (TSS), fat-oil-grease (FOG), pathogenic and other micro-flora, organic matters and nutrients.
Biological oxygen demand (BOD) is a measure of the amount of oxygen consumed by bacteria and protozoa for oxidation and decomposition of organic matters in one litre of water under aerobic conditions at a specified temperature (Delzer & Mckenzie, 1999). When the organic matters such as fish wastes present in the waste effluent. The bacteria will start to break down the organic wastes. This process requires huge amount of oxygen and hence the oxygen concentration in the water will be reduced, causing the aquatic animals to lack of oxygen for living. Likewise for Chemical Oxygen Demand (COD), COD is the measurement of amount of oxygen required for oxidation of organic compounds and inorganic matters in one litre of water (Yang et al., 2009). High COD level indicates that there are great amount of oxidizable organic matters in the solution and hence will consume great amount of dissolved oxygen for oxidation process, leading to anaerobic conditions which is endangering all the aquatic life forms. Other than that, total suspended solids (TSS) are the solid organic materials and minerals that remain trapped in the water sample filtered through 1.2
Vs = the volume of hydrochloric acid used to neutralize the sample, in unit of ml,
Vb = the volume of hydrochloric acid used for blank titration, 0.83 ml,
NHCl = the normality of the hydrochloric acid used, 0.1N,
MN = the molar mass of nitrogen, 14 gmol-1,
WS = the weight of the sample, 2g,
CHAPTER 4
RESULT AND DISCUSSION
In order to improve the continuous environmental performance, this analysis was conducted with a motivation to reduce the product’s impact on environment. This thesis will highlight the waste produced from fish processing manufacturing and quantify the perceived potential improvement and establish whether there are still opportunities that could be explored to optimize the environmental performance of the product.
Figure 4.1 shows the scope and boundary of the life cycle stages of canned fish product. The scope was the process flow from raw material to product and the system boundary included the solid waste and wastewater produced from this process flow.


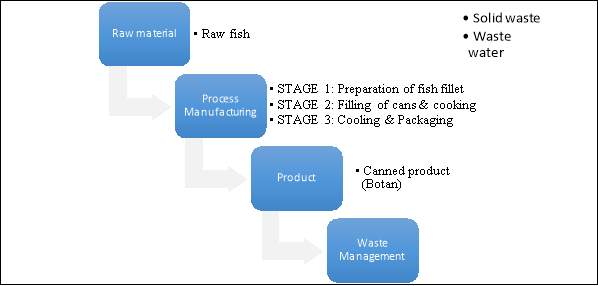
Figure 4.1: Scope and boundary of this study.
4.2 Life Cycle Inventory (LCI) Assessment
The inventory data of inputs and outputs of canned fish products manufactured in the company were recorded and analysed. List of inputs and outputs for the chosen system boundary was shown in Figure 4.2. Inputs include the resources, water and energy used. Outputs include emissions to land, water and air.
OUTPUTS
Emission to:
Land
Water
Air
INPUTS
Materials:
Resources
Energy
Water
Figure 4.2: Inputs and Outputs of chosen boundary.
4.2.1 Process Flow of Canned Fish Product Manufacturing
To obtain the necessary inventory data, the process flow of manufacturing the canned fish products was comprehensively studied in order to understand the material and energy flow in the manufacturing system. The manufacturing system in this case study involved 42 main processes. It consist of three stages as follow:
Stage 1: Preparation of Fish Fillet
Stage 2: Filling of Cans & Cooking
Stage 3: Cooling & Packaging of Cans
Figure 4.3 shows the 3 stages of the process flow. The description of each subsystem in the process flow were explained in Table 4.1. The process flow began with Stage 1 which was the preparation of fish fillet. The stored frozen fish were taken out and thawing was carried out by immersing the frozen fish in the public portable water. After thawing, the raw fish were butchered to separate the fish fillet from inedible parts such as heads and guts. The raw fish fillets were then went through metal detector for metal inspection and iced to maintain their quality. At the end of Stage 1, the raw fish fillet were transferred to workbenches for further processing in Stage 2.
In Stage 2, the raw fish fillets were first washed to remove unwanted substances and then sorted manually by visual inspection before filling into the cans. The cans were filled with water, tomato sauce and vegetable oils with constant weight check after each filling. After oil filling, the cans and the contents were exhausted to remove the gases and vapour in order to avoid trapping of air inside the cans. Immediately after the cans were exhausted, the lids were seamed to the cans, hence, a vacuum was created inside the cans after the contents cooled down in order to prevent the growth of microorganisms. The cans were then inspected visually to detect the seam defects and the rejected cans would be sent for re-pack to eliminate the seam defects. After seaming detection, the cans were washed with public potable water and detergent before retorting. During retorting, the cans were heated in the pressure cookers to cook the contents and remove the microorganisms that may present in the content. Stage 2 was completed with the end of retorting process.
After retorting, the cans were cooled by immersing them into the public chlorinated water and subsequently dried by industrial fans in Stage 3. The cans were inspected visually before packing. The cans were labelled and stored in the warehouse before they were shipped to the end customers.
 Stage 1: Preparation of Fish Fillet
1. Frozen Fish Receiving

2. Frozen Fish Storage

3. Public Potable Water
4. Frozen Fish Thawing
5. Butchering
6. Metal Detection
(CCP 1)
8. Icing
9. Transferring to Workbench

7. Ice
 Stage 2: Filling of Cans & Cooking
10. Fish Washing
11. Fish Sorting
12. Receiving, Storage, Depalletizing, Inversion & Cleaning of Cans

13. Fish Filling
14. Weighing Check

15. Public Potable Water
16. Water Filling


21. Head Spare Adjusting
23. Oil Filing
17. Can Inversion
18. Weighing Check
19. Receiving, Storage & Mixing of Ingredients
20. Sauce Filling


22. Receiving & Storage of Vegetable Oil
24. Exhausting
28. Re-pack

25. Receiving, Storage &Coding of Lids
26. Seaming (CCP 2)

27. Seaming Detection

29. Public Potable Water & Detergent
30. Can Washing
31. Weighing Check
32. Can Loading in Retort Crate
33. Retorting (CCP 3)
Stage 3: Cooling & Packaging of Cans


34. Public Chlorinated Water
35. Can Cooling
36. Drying & Fan Cooling
37. Visual Can Inspection

39. Labelling & Box-up
38. Receiving & Storage of Packaging Materials
40. Palletizing
41. Storage
42. Shipping
Figure 4.3: Complete process flow of packed sardine and mackerel products manufactured in Protigam Food Industries Sdn. Bhd.
Table 4.1: The description of each subsystem in the process flow.
| Subsystem | Description |
| Frozen Fish Receiving | The raw fish received was in frozen form. |
| Frozen Fish Storage | The frozen raw fish was stored in the storage at a temperature of -23 0C to maintain the highest quality of the raw fish. |
| Frozen Fish Thawing | The frozen raw fish were immersed in the public potable water to be warmed and defrosted. |
| Butchering | The raw fish were cut up to separate the fish fillets from inedible parts such as heads, guts and fins. The inedible fish parts were then sent for waste treatment. |
| Metal Detection (CCP 1) | The fish fillets went through metal detector for metal inspection to prevent the fish fillets which contains metals from being processed into products. This step is the first critical control point in the process flow. |
| Icing | The fish fillets were surrounded by ice to maintain the quality of the fillets. |
| Workbench | The fish fillets were transferred to the industrial workbenches for further processing. |
| Fish Washing | The fish fillets were washed with clean water to remove the blood, dirt and other unwanted substances. |
| Fish Sorting | The fish fillets were sorted manually by visual inspection. Only fish fillets of good quality and appearance were allowed for further processing. The rejected fillets were then sent for waste treatment. |
| Receiving, Storage, Depalletizing, Inverting and Cleaning of Cans | The cans received and stored in the warehouse were depalletized, inverted and cleaned for filling of fish and other additives. |
| Fish Filling & Weight Check | The sorted fish fillets were filled into the cleaned cans and weight checked. |
| Water Filling | The public potable water was filled into the cans containing fish fillets. |
| Can Inversion & Weight Check | The cans were inverted and weight checked for further filling with sauce or brine. |
| Receiving, Storage and Mixing of Ingredients | The ingredients received and stored in the stock were mixed together to form the sauce. |
| Sauce Filling | The sauces were filled into the cans containing fish fillets and water. |
| Receiving and Storage of Vegetable Oil & Oil Filling | The vegetable oil received and stored in the stock was filled into the cans containing fish fillets, water and sauce. |
| Receiving, Storage and Coding of Lids | The lids received and stored in warehouse were coded in order to be used for seaming. |
| Exhausting | The cans and the contents were heated by passage through a boiler and the free passage of gases out of the cans were allowed to avoid trapping of air inside the cans. |
| Seaming (CCP 2) | The lids were seamed to the cans immediately after the cans passed the boiler, hence a vacuum was created inside the cans after the contents cooled down. This step was the second critical control point in the process flow. |
| Seaming Detection | The cans were carefully inspected through visual inspection to detect the seam defects on the cans. |
| Re-pack | The cans which were rejected during seaming detection would be sent for re-pack in order to eliminate the seam defects. |
| Can Washing & Weight Check | The cans were cleaned by washing with public potable water and detergent and weight checked before retorting. |
| Can Loading In Retort Crate | The cans were loaded in the retort crate to get ready for retorting. |
| Retorting (CCP 3) | The cans were heated in the pressure cookers at temperatures above 100 0C to cook the contents and eliminate all pathogenic spoilage micro-organisms which may exist in the content. This step was also the third critical control point in the process flow. |
| Can Cooling | The cans were cooled by immersing them into the public chlorinated water. |
| Drying & Fan Cooling | The cans were then dried and cooled by industrial fans. |
| Visual Can Inspection | The cans were inspected visually and only cans which were remained intact were allowed to proceed to packaging stage. |
| Labelled & Boxed-up | The cans were labelled with the brand name and boxed-up together into large cardboard boxes. |
| Palletizing | The boxes were stacked onto the pallets using palletizers. |
| Storage | The pallets of boxes were stored inside the warehouse. |
| Shipping | The boxes of cans were shipped to the end customers |
The inputs and outputs of these specific subsystems based on one day production were listed in Table 4.2, Table 4.3 and Table 4.4. The significances of the inventory data in Table 4.1, Table 4.2 and Table 4.3 were discussed in details to understand the overall material and energy flow of all the stages. The Life Cycle Impact Assessment (LCIA) will be carried out based on the result of inventory data.
Table 4.2: Inventory data for Stage 1 in the process flow.
| Process | Input | Output | |||
| Material | Material for Processing | Energy
(kWh) |
Wastewater (tonnes) | Solid wastes (tonnes) | |
| Frozen fish storage | Fish (25 tonnes) | – | 2000 | – | – |
| Frozen fish thawing | Fish (25 tonnes) | Water (10 tonnes) | – | 10 | – |
| Butchering | Fish (25 tonnes) | – | 52.2 | – | 5.25 |
| Icing | Fish (19.75 tonnes) | Ice (400 tonnes) | – | 400 | – |
Table 4.3: Inventory data for Stage 2 in the process flow.
| Process | Input | Output | |||
| Material | Material for Processing | Energy
(kWh) |
Wastewater (tonnes) | Solid wastes (tonnes) | |
| Fish
washing |
Fish (19.75 tonnes) | Clean water (30 tonnes) | – | 30 | – |
| Fish sorting | Fish (19.75 tonnes) | – | – | – | 0.32 |
| Exhausting | Fish (19.43 tonnes) | Steam (8000 litres), Diesel oil for motors (600 litres) | 37.3 | – | – |
| Seaming | Fish (19.43 tonnes) | – | 22.4 | – | – |
| Can washing | Fish (19.43 tonnes) | Public potable water with detergent (5.02 tonnes) | – | 5.02 | – |
| Retorting | Fish (19.43 tonnes) | Steam (1000 litres), Diesel oil for motors (3000 litres) | 32358 | – | – |
Table 4.4: Inventory data for Stage 3 in the process flow.
| Process | Input | Output | |||
| Material | Material for Processing | Energy
(kWh) |
Wastewater (tonnes) | Solid wastes (tonnes) | |
| Can cooling | Fish (19.43 tonnes) | Chlorinated water (30 tonnes) | – | 30 | – |
| Drying & Fan cooling | Fish (19.43 tonnes) | – | 120 | – | – |
From Table 4.2, the inputs and outputs of Stage 1 were contributed by the 4 subsystems, including frozen fish storage, frozen fish thawing, butchering and icing. In terms of inputs, the initial input of raw fish was 25 tonnes but the value decreased to 19.75 tonnes due to the elimination of 5.25 tonnes of inedible fish parts. These inedible fish parts were separated from fish fillet by butchering process and contributed to the output of process flow as solid wastes. The subsystem of frozen fish storage and butchering consumed 2052.2 kWh per day while about 410 tonnes of wastewater was obtained, contributed by thawing and icing process.
As can be seen in Table 4.3, the subsystems involved are fish washing, fish sorting, exhausting, seaming, can washing and retorting. The amount of fish input was reduced from 19.75 tonnes to 19.43 tonnes as 0.32 tonnes of fish fillet were rejected in the process. The energy consumption in this stage was significantly higher than other 2 stages due to the extremely high electricity usage of retorting process with the value of 32358 kWh/day. Besides retorting, there were also consumption of 37.3 and 22.4 kWh/day by the processes of exhausting and seaming. 30 tonnes of clean water was used in the process of fish washing while 5.02 tonnes of public potable water including detergent were consumed for can washing. These water was then removed completely as wastewater at the end of those processes. In exhausting and retorting process, about 8000 litres of steam was needed for both processes which was recycled back in the manufacturing processes. About 1600 litres of diesel oils was consumed in both processes, and were emitted to the surrounding in the form of gases as well as heat and sound energy by the machineries and motors.
In Table 4.4, about 30 tonnes of chlorinated water were used to cool the cans and were eliminated as wastewater from the process flow. In addition, the industrial fans used in the process of drying and fan cooling also consumed 120 kWh of electricity per day.
In conclusion, the results of inventory data showed the significant roles of certain processes for the production of solid wastes and wastewater as well as energy consumption. From these results, impact categories were identified and the assessment will be made according to these categories which will be discussed in the next section.
4.3 Life Cycle Impact Assessment (LCIA)
To carry out LCIA, the impact categories of fish processing industry were studied and identified. There are a lot of impact categories that has been used in other LCA studies such as climate change, human toxicity, acidification, eutrophication and stratospheric depletion Table 4.5 shows the impact categories indicators that are related to this study.
Table 4.5: Impact categories indicators (BIO Intelligence Service, 2006).
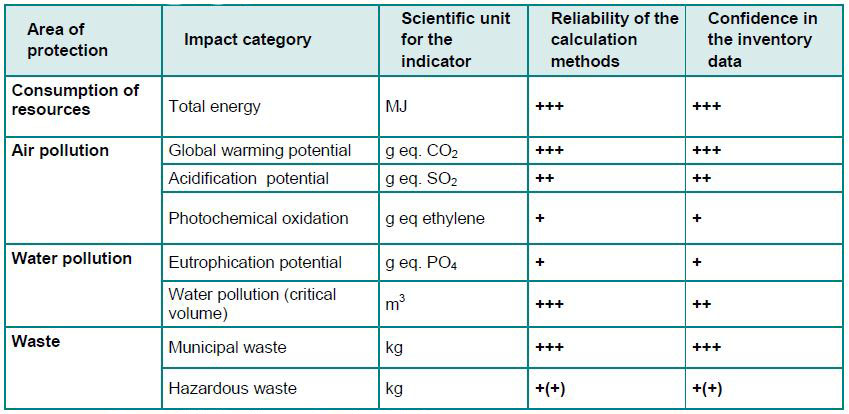
In Table 4.5, 4 major areas of protection with the impact categories were described by the reliability of calculation methods and the confidence in the inventory data. It is noted that there are differences in reliability and confidence values for the impact categories. For impact categories such as total energy consumption, global warming potential, water emission (critical volume) and municipal wastes, the inventory data can be obtained in exact values and high in accuracy and hence their reliability and confidence values are high. Impact categories such as eutrophication potential and photochemical oxidation has low reliability and confidence values because their inventory data cannot be gained in exact values and can only be obtained based on assumptions such as equivalence factors of PO4. Therefore, in this case study, the impact categories of municipal solid wastes, water pollution (critical volume), eutrophication potential and total energy consumption were selected based on the result of inventory data as well as the reliability and confidence values of inventory data.
Solid wastes are commonly classified into two groups; municipal waste and hazardous waste. Municipal solid waste (MSW) is defined as the type of waste consisting of various daily items which are discarded by the people and industries such as food and kitchen wastes, paper, glass bottles, light bulbs, batteries and tin cans. The common characteristics of all kinds of MSW are non-toxic and can be disposal through common methods such as landfilling. In contrary, hazardous waste is defined as waste that poses substantial or potential threats to public health or the environment such as discarded chemical products, hospital waste and photo processing waste. Hazardous wastes usually require special treatments and handling methods for disposal. In this case, solid waste represented about 20–60 % of the initial raw material contains various kinds of residues (whole waste fish, fish head, viscera, skin, bones, blood, frame liver, gonads, guts, some muscle tissue, etc) and were considered as non- toxic solid waste. Hence, the solid wastes in this case were categorized in the category of municipal wastes. This waste could give health implications if this wastes are decomposing inside the plant area. Other than that, this wastes also would attract pests, flies and domestic animals if this wastes were not handled in proper manner. Table 4.6 shows the daily production of solid wastes in this case study.
Table 4.6: Daily production of solid waste in the process flow.
| Stages of Processing | Solid Waste | Amount (tonnes) |
| Butchering | Fish heads and residual fish | 5.25 |
| Fish sorting | Rejected fish meat | 0.32 |
| Total | 5.57 |
From Table 4.6, approximately 5.57 tonnes of solid waste was generated daily from process of butchering and fish sorting. This wastes were stored in drum container which would then be collected by third party as feed materials for fish farming. However, in our point of view, the problem of solid wastes disposal do not solved here. Due to the abundance of organic matters and nutrients in the solid wastes, the solid wastes which are utilized for fish farming probably increases the values of BOD, COD, TSS and FOG of the water in the fish farm and thus leads to water pollution.
Other than municipal wastes, solid fish wastes are also categorised as food waste. Lim et al. (2016) mentioned that landfill is the most common method for food waste disposal in Malaysia. The disposal of food waste such as solid fish wastes at the landfill sites is the one of the largest sources for emission of greenhouse gasses (GHG), such as methane (CH4) and carbon dioxide (COs). Table 4.7 shows the greenhouse gases emission due to landfill of solid wastes which is presented by U.S. EPA (2015).
Table 4.7: Net GHG emission from landfilling (MTCO2E/short ton) (U.S. EPA, 2015).

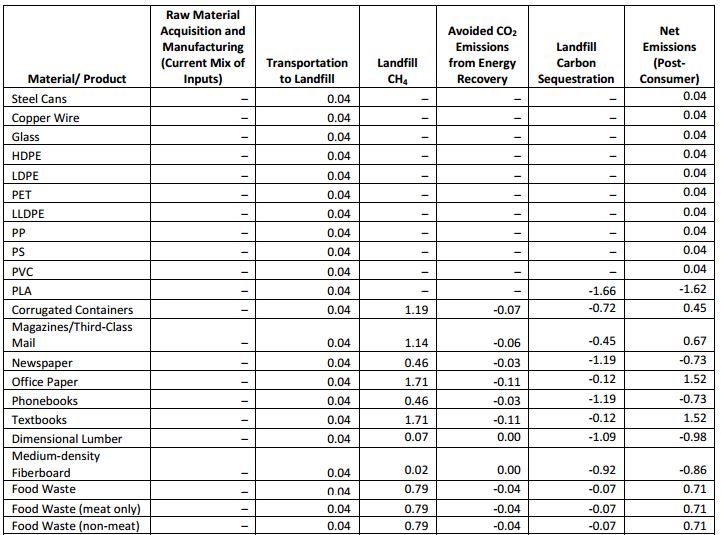
There is an emission of methane (CH4) of 0.79 MTCO2E and 0.71 MTCO2E of carbon dioxide (CO2) produced for each 0.04 short tonnes of food waste transported for landfilling as shown in Table 4.7. Therefore, about 110 MTCO2E of CH4 and 98.87 MTCO2E of CO2 were released to the environment if 5.57 tonnes of solid fish wastes were produced in this case. However, these values are only based on one company. Currently, there are hundreds of companies and enterprises of fish industry in Malaysia. Theoretically, if the data of all solid wastes from the related companies and enterprises across Malaysia are summed up, the total values of CH4 and CO2 emission will be very significant and possibly lead to severe greenhouse effects. Therefore, effective monitoring of solid fish waste disposal is needed to prevent the increase in emission of the greenhouse gases. Besides disposal, utilization of solid fish wastes should also be employed as one of the fish waste management methods. The solid fish wastes are versatile products which are rich in protein and minerals. Hence, solid fish wastes should also be considered to be utilized in the production of protein or mineral based materials such as protein-based thermoplastics.
Amoaty & Bani (2011) defined wastewater as the water that have been adversely affected due to the introduction of certain substances which render it unsafe for purposes such as drinking. In this case, the wastewater was the water contaminated with various substances such as organic matters, oil, fats, grease and suspended solids which contributed to the impact categories of water emission (critical volume) and eutrophication potential. The evaluation of the impact categories will be discussed in details in the next sections. Table 4.8 shows the average characteristics of wastewater produced in one day production in this case study.
Table 4.8: The average characteristics of wastewater in daily production.
| Characteristics of Effluent | Value |
| Flow rate | 240 m3/day |
| Biological Oxygen Demand (BOD) | 3000 mg/L |
| Chemical Oxygen Demand (COD) | 6000 mg/L |
| Total Suspended Solid (TSS) | 1000 mg/L |
| Fat, Oil and Grease (FOG) | 500 mg/L |
From Table 4.8, the flow rate of the effluent produced is 240 m3 per day. It was noted that the effluent before treatment had very high values in BOD, COD, TSS and FOG with concentration of 3000, 6000, 1000 and 500 mg/L respectively. These environmental parameters were extensively employed in the discussion of the impact categories of water emission (critical volume) and eutrophication potential in the following sections.
4.3.2.1 Water Pollution (Critical Volume)
For this impact category, the Malaysian Environmental Quality Regulations were referred in order to compare with the experimental effluent produced in this case study. Table 4.9 shows the parameter limits of effluent in Malaysian Environmental Quality (Sewage and Industrial Effluent) Regulations 1979, 1999 and 2000 (DOE, 2010). In this study, the company follows Standard B as their reference standard. Figure 4.4 illustrates the comparison of average concentration of BOD, COD, TSS and FOG between the company’s effluent and the parameter limits of the regulation.

 Table 4.9: The parameter limits of effluent of standard A and B under Malaysia Environmental Quality Regulations, 1979, 1999, 2000 (DOE, 2010).
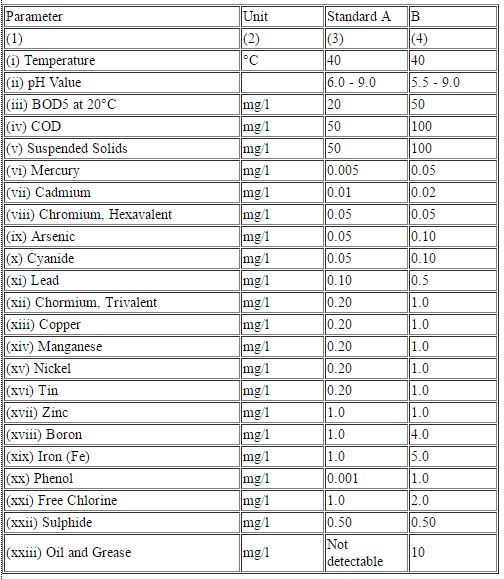
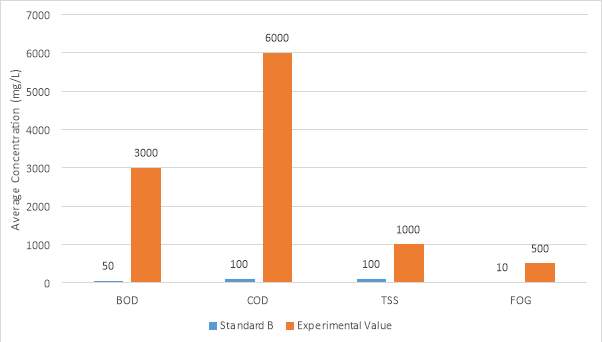
Figure 4.4: Comparison between standard B parameter limits and the obtained values from the processing effluent.
It is noted that without wastewater treatment performed, the values of concentrations for the environmental parameters of processing effluent exceed the parameter limits of Standard B by great factors. These values indicate that the processing effluent has very high potential to cause water pollution if the processing effluent is discharged into the aquatic environments such as rivers and seas.
The high BOD and COD values of the processing effluent indicates that the processing effluent contains high concentration of organic matter. Huge amount of oxygen is required for the oxidation and decomposition of these organic matters in the water. Hence, the rate of oxygen consumption in the water will greatly increases. The high oxygen consumption rate will causes lower oxygen concentration in the water, leading to the death of aquatic organisms.
Besides, the high TSS value of the processing effluent is a potential threat to the aquatic animals such as turtles. This is because these aquatic animals may consume the suspended solids of the effluent and get poisoned by the toxicity of the suspended solids. In addition, the high FOG value of processing effluent implies that the effluent can cause blockage of sewage system as these fats, oils and grease will accumulate at the sewer network. This phenomenon can leads to flooding of workplace because any accumulation of debris in the waste effluent pipeline system can rapidly overload the sewer network due to the blockage caused by fats, oils and grease. Hence, the processing effluent needed to be treated properly before releasing into the environment.
4.3.2.2 Eutrophication Potential
Eutrophication is the abundance of nutrients in the aquatic environments. Eutrophication is often characterized by excessive algae growth in the aquatic environments which prevents the sunlight from reaching the lower depths (Chislock, 2013). This phenomenon causes the increased availability of one or more restraining growth factors required for photosynthesis such as sunlight, carbon dioxide, and fertilizers (Schindler, 2006). Hence, eutrophication indirectly leads to a decrease in photosynthesis and lower oxygen production. In addition, the decomposition of algae also requires high consumption of oxygen. These effects result in great reduction of oxygen concentration in the water, and eventually can lead to the death of aquatic animals. Therefore, eutrophication potential is the potential of a substance to cause eutrophication in the water environment and measured in the unit of phosphate equivalents (PO4 Eq). The wastewater from food processing industry has high eutrophication potential as the food processing wastewater usually rich in nutrients, especially the animal nutrients. Figure 4.5 shows the eutrophication process due to the release of wastewater from the industries.
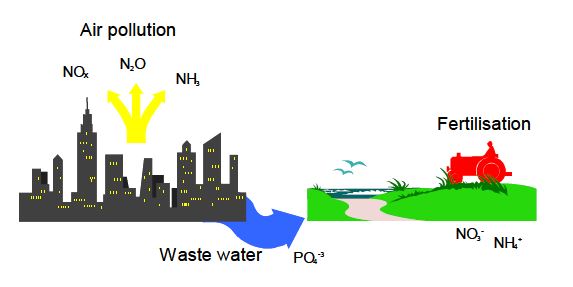
Figure 4.5: Eutrophication process (Leif & Stefan, 2007)
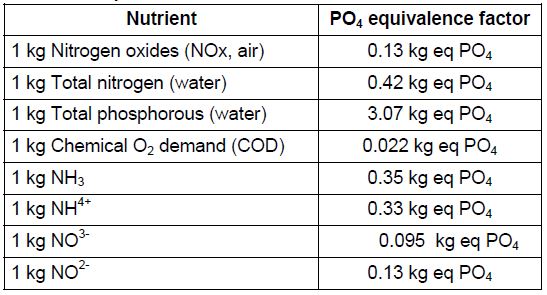
In order to understand the eutrophication potential of the processing effluent, a table of PO4 equivalence factors was referred. The calculation of eutrophication potential of the effluent is done by employing PO4 equivalence factors of COD.
Table 4.10: PO4 equivalence factors of various substances (Bio Intelligence Service, 2006).

Calculation of Eutrophication Potential for the processing effluent:
Chemical Oxygen Demand (COD) of the processing effluent = 6000 mg/L
=
6000×10-6kg10-3m3
= 6 kg/m3
Total amount of the processing effluent = 240 m3/day (Data provided by the company)
Total COD of the processing effluent = 6 kg/m3
×240 m3/day
= 1440 kg/day
PO4 equivalence factor per 1kg COD = 0.022 kg eq PO4
Eutrophication Potential of the processing effluent = 1440 kg/day
×0.022 kg eq PO4
= 31.68 kg eq PO4 / day
Hence, in this case study, about 31.68 kg eq PO4 was produced per day. This value was then used to calculate the eutrophication potential of each subsystem in the process flow. In order to carry out the calculation, the amounts of effluent produced in the related subsystems were obtained from the inventory data of Table 4.2, Table 4.3 and Table 4.4 and listed in Table 4.11. From Table 4.11, the total amount of effluent produced in the process flow was 475.02 tonnes daily. The contribution of each subsystem to the total eutrophication potential of the processing effluent were calculated and later discussed in the stage of Interpretation of Result of LCA.
Table 4.11: Eutrophication Potential of each subsystem in the process flow.
| Stage of Processing | Amount of effluent (tonnes) | Total eutrophication potential of effluent (kg eq PO4 / day) | Eutrophication Potential of each subsystem
(kg eq PO4 / day) |
| Frozen Fish Thawing | 10 | 31.68 | 0.67 |
| Icing | 400 | 26.68 | |
| Fish Washing | 30 | 2.00 | |
| Can Washing | 5.02 | 0.33 | |
| Can Cooling | 30 | 2.00 | |
| Total | 475.02 |
4.3.3 Total Energy Consumption
Energy consumption has a major effect on the environment as most of the electricity is generated by high usage of the resources such as water, fossil fuels and nuclear fuels. In Malaysia, the electrical power is mainly supplied by fossil fuel power plant. Hence, the electricity usage in the industries is indirectly related to the consumption of fossil fuels. To generate electricity, the fossil fuels are usually burnt to produce steam in order to drive a steam turbine which will then drive the electrical generator. Table 4.12 shows the electricity usage of each subsystem in the process flow.
Table 4.12: Amount of electricity usage for the related subsystems in the process flow.
| Stages of Processing | Equipment | Amount of electricity usage (kWh) |
| Frozen Fish Storage | Cold storage | 2000 |
| Butchering | Butchering machines | 52.2 |
| Exhausting | Boilers | 37.3 |
| Seaming | Seamers | 22.4 |
| Retorting | Pressure cookers | 32358 |
| Drying and Fan Cooling | Industrial fans | 120 |
| Total | 34589.9 |
The total electricity usage of the canned fish product manufacturing system is estimated to be 34589.9 kWh / day. According to the inventory data, the canned fish products produced each day is 19.43 tonnes in average and hence, the value of electricity usage for each tonne of canned fish product produced is 1780.23 kWh per tonne. To understand the environmental impact of the energy consumption for fish canning, the data of energy consumption for fish canning obtained from Somsanith et al. (2008) is referred. Somsanith et al. (2008) calculated the data of energy consumption for fish canning from the report of United Nation’s Environment Programme (UNEP).
Table 4.13: Amount of energy consumption per tonne of product for fish canning (Somsanith et al., 2008)
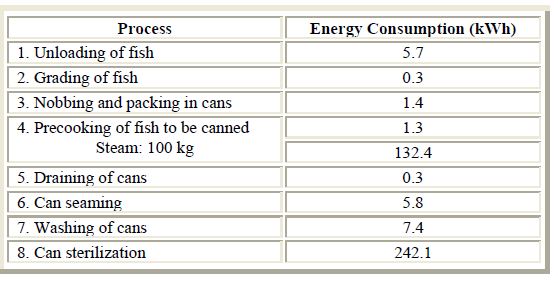
From Table 4.13, the total energy consumption for fish canning processes is only 396.7 kWh per tonne of canned fish products. The total energy consumption of fish canning processes in this case study is significantly higher than that of reference value. The large difference in energy consumption indicates that the energy efficiency of the manufacturing processes of the company is not high and need to be improved. Low energy efficiency usually cause energy waste and high electricity consumption, indirectly increases the consumption of fossil fuel. When the fossil fuels are burnt in the power plant to generate electricity, carbon dioxide and other harmful air pollutants are emitted to the environment. EIA (2015) mentioned that about 78 percent of United States’ global warming emission were energy-related emission of carbon dioxide due to the burning of fossil fuels in power plants. Not only that, EPA (2016) also described the formation of acid rain due to the mixing of sulphur dioxide (SO2) and nitrogen dioxide (NO2) which are emitted by combustion of fossil fuels. Hence, the high energy consumption of canning processes in this case study will indirectly increase the consumption of fossil fuels in the power plants and contribute to the emission of carbon dioxide and other air pollutants such as sulphur dioxide and nitrogen dioxide which eventually lead to global warming and air pollution. Therefore, the energy efficiency of the canning processes of the company should be improved in order to reduce the energy consumption and related environmental impacts such as global warming and air pollution.
The normalization step in LCIA of this work is to find the value of impact categories per unit functional unit in order to perceive the relative magnitude of each environmental indicator. This procedure transforms the result of an indicator by dividing it by a selected reference value. Table 4.14 shows the summarized result of impact categories in this case study.
Table 4.14: The values of impact categories in this case study.
| Impact Categories | Amount / Value |
| Municipal Solid Waste (MSW) | 5.57 tonnes / day |
| Eutrophication Potential (EP) | 31.68 kg eq PO4 / day |
| Energy Consumption (EC) | 34589.9 kWh / day |
The functional unit in this work is every 1 tonne of raw fish entering the factory. Hence, the reference value selected is the total amount of raw fish entering the factory of the company. According to the data provided in this case study, the average amount of raw fish entering the factory is 25 tonnes / day. Therefore, the normalization of result is dividing the values of impact categories by average amount of raw fish entering the factory per day. Table 4.15 shows the normalized values of the impact categories and Figure 4.6 illustrates the log normalized values of the respective impact categories.
Table 4.15: Normalized values per unit functional unit.
| Impact Categories | Normalized Value Per Functional Unit |
| Municipal Solid Waste (MSW) | 0.22 tonnes / day |
| Eutrophication Potential (EP) | 1.27 kg eq PO4 / day |
| Energy Consumption (EC) | 1383.6 kWh / day |
From Table 4.15, it can be noted that for every 1 tonne of raw fish entering the factory, there is 0.22 tonnes of municipal solid waste (solid fish waste) produced, an increase of 1.27 kg eq PO4 in eutrophication potential of the aquatic environment where the effluent is discharged and consumption of 1383.6 kWh of electricity after production daily. This indicates that the manufacturing processes flow has highest tendency in contributing to the increase in global warming and air pollution through high energy consumption. Hence, these impact categories should be minimized and improved in order to protect our environment, especially the category of energy consumption.
In this stage, contribution analysis was carried out for interpretation of the LCA result of this case study. The subsystems under study are only the subsystems which contribute to the impact categories of MSW, EP and EU.
Contribution analysis is the analysis of the contributions of each subsystem to the relative impact categories in analytical LCA. Hence, contribution analysis allowed us to identify the subsystems with the highest environmental loads. Figure 4.6 illustrated the contribution of subsystems in specific impact categories respectively.
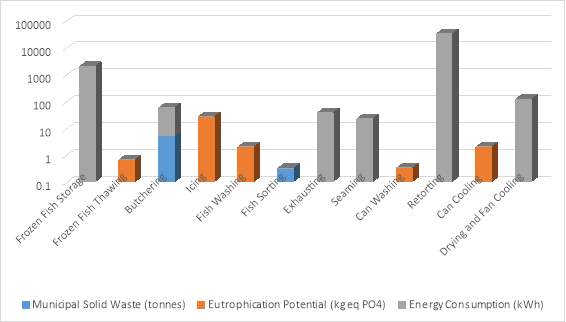
Figure 4.6: Comparison between subsystems for all the related impact categories.
As can be seen in Figure 4.6, the butchering process contributes the most significant amount of municipal solid wastes which is 5.25 tonnes, followed by fish sorting process. This is because butchering process remove the fish heads and residuals from the raw fish and these fish heads and residuals such as livers, guts, roe, backbones, fins and skins actually make up more than 50% of the total weight of a fish. Therefore, butchering process produces the solid wastes which have the highest weight among the processes.
In the case of eutrophication potential, icing process makes the biggest contribution with the value of 26.68 kg eq PO4, followed by fish washing process with the value of 2.14 kg eq PO4. During icing, the raw fish fillets and meats are surrounded by the ices and some of the nutrients of the fillets and meats are released into the ice through blood and fluids. Hence the wastewater of icing process has the highest eutrophication potential due to the greatest abundance of nutrients.
Besides, retorting process is obviously the most significant source of energy consumption among the processes by consuming 32358 kWh per day, followed by frozen fish storage. The very high energy consumption of retorting process is due to the high electricity usage of pressure cookers. Pressure cookers are needed to exert high pressure and temperature to cook the content of cans during retorting and hence a lot of electricity is used to generate the high pressure and temperature of pressure cookers. Therefore, retorting process contributes to the largest part of total energy consumption.
In conclusion, butchering, icing and retorting are the biggest contributor for impact categories of municipal solid wastes, eutrophication potential and energy consumption respectively. The performances of these subsystems need to be monitored and improved to prevent severe damages to the environment.
4.5 Waste Treatment Approach for Fish Product Manufacturing
Protigam Food Industries Sdn. Bhd. implements the typical end-of-pipe treatment system for the processing wastes generated to fulfil the parameter limits of Standard B of Malaysian Environmental Quality (Sewage and Industrial Effluent) Regulations 1979, 1999 and 2000 (DOE, 2010). The waste treatment system of the company mainly comprises of Industrial Effluent Treatment Systems (IETS) which is required under Industrial Effluent Regulation, 2009 (IE2009) (DOE, 2010). Figure 4.7 shows the overall wastewater treatment process flow for Industrial Effluent Treatment System (IETS) of waste treatment plant in this case study.

Static Screens
Oil & Grease Trap (Collection Sump)
Waste Water from Factory


Equalization Tank (EQ)
Dissolved Air Floatation Unit (DAF)
Tricking Filter Tower (TF) & TF Tank
Extended Aeration Tank
Secondary Clarifier
Final Discharge (Compliance to Standard B) &
Volute Dewatering Press
Figure 4.7: The wastewater treatment process flow for Industrial Effluent Treatment System (IETS) of waste treatment plant in Protigam Food Industries Sdn. Bhd.
From Figure 4.7, he wastewater treatment process (WWTP) begins with the transportation of wastewater from the factory to the treatment plant through piping system. When the wastewater enter the treatment plant, the wastewater will first pass through the oil and grease trap to filter the oil and grease content of the wastewater. About 40 – 50 kg of oil and grease can be obtained daily. After going through the oil and grease trap, the wastewater will flow through the static screens to remove the large floating substances and foreign particles which may cause problems for further treatment and blockage of piping equipment.
Then, the wastewater will flow into the Equalization (EQ) tank which can accommodate a maximum volume of 240 tonnes. The main function of the EQ tank is to act as buffer to maintain the desired flow rate of the wastewater. Hence, the EQ tank will store the effluent during peak hours which the flow rate of wastewater is high and release the effluent during non-peak time where incoming effluent is little. The next destination after EQ tank for the wastewater is Dissolved Air Floatation (DAF) unit. The purpose of DAF unit is to remove the suspended matter such as oils or solids from the wastewater. When the wastewater moves into the DAF unit, the wastewater enters into the floatation vessel where the wastewater is topped up with polymers to form saturated wastewater. The pressure within the vessel is increased to ensure a higher concentration of air dissolves into the liquid phase. When the saturated wastewater flows into the floatation tank, the pressure is converted back to the level of atmospheric pressure, making the recycled flow to become very saturated and producing a lot of bubbles because the dissolved air comes out of the solution. The bubbles will attach to or form within the solids or chemical flocculants in the wastewater, causing the solids to float to the surfaces where they are retained and subsequently removed by a mechanical skimmer. About 50% – 60% suspended solids of wastewater are trapped in the DAF unit.
After DAF unit, the wastewater will flow into Tricking Filter (TF) tower. The TF tower is a biological reactor that operates under aerobic conditions. The TF tower consists of a cylindrical tank and is filled with high specific surface material to provide a large area for biofilm formation. When the wastewater enter the TF tank, the natural bacteria in the biofilm will oxidize the organic matter in the wastewater to carbon dioxide and water, thus creating new biomass. The wastewater is then going through an extended aeration tank for secondary or biological treatment. The biological treatment is performed in a tank containing the activated sludge. In the aeration tank, air is pumped into the tank for the microbes that remain on the activated sludge. The microbes consume the dissolved and particular organic matter of the sludge and hence separate the sludge from the water. This process is done in the secondary clarifier which is next to the aeration tank. Some of the sludge are sent back to the aeration tank to treat more wastewater and the remaining sludge is pumped away from the secondary clarifier for further treatment. Approximate 60% water and 40% sludge are generated after passing through secondary clarifier.
After secondary clarifier, the water produced are tested for the values of BOD, COD, TSS and FOG in order to ensure the quality of the water is in compliance to the Standard B of Malaysian Environmental Quality (Sewage and Industrial Effluent) Regulations 1979, 1999 and 2000 before final discharge. On the other hand, the sludge produced are sent to a press machine for dewatering process. The sludge is compressed by the press machine to remove the remaining water inside the sludge and hence, solid wastes are generated from the sludge. About 1200 – 1500 kg of solid wastes can be obtained from the sludge according to the data of the company. The solid wastes are still rich in nutrients and therefore, the solid wastes are being processed into fertilizers and given to the farmers for farming.
Currently, there is no recovery of protein from the fish wastes are done at this stage. In my point of view, the solid wastes produced from the sludge still contain a high concentration of protein. The protein content of solid wastes should be utilized for a better purpose such as production of protein-based material.
4.6 Alternative Waste Management Approach – Fish Protein-based Thermoplastic
The waste treatment approach implemented in this case study is highly efficient and effective as the quality of treated wastewater is in compliance with the standards of Malaysian Environmental Law before final discharge. However, the waste treatment also incur high cost such as the material cost, operating cost and maintenance cost. The company does not earn any profit from the final products as the fertilizers are given free to the farmers for farming. Hence, an alternative way of utilizing the fish wastes should be considered.
In this work, transforming the fish wastes into protein-based thermoplastic is the suggested alternative approach for utilizing the fish wastes generated. In Chapter 2, it is understood that the fish protein is polymerizable due to the presence of amino acids. Esteban et al. (2007) also mentioned that there is about 58% of crude protein in the composition of fish waste. This fact indicates that polymerization of the crude protein of fish waste into protein-based thermoplastic is possible. Svenson et al. (2013) proved that the fish meal which was produced from by-products of farmed Norwegian salmon (S. salar) can be plasticized with hydrophilic plasticizers and subsequently compression moulded into consolidated polymers. This is due to the fact that fish protein contains well balanced amino acid compositions consisting of eight essential amino acids and eight non-essential amino acids. Leu et al. (1981) stated that fish protein are mainly composed of glutamic acids (15 – 18%) and aspartic acid (11 -12 %) as well as other types of amino acids. These amino acids can be polymerized through condensation polymerization by forming polypeptides as shown in Figure 4.8.
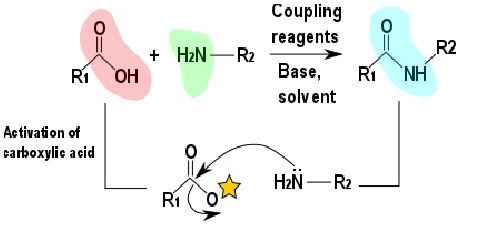
Figure 4.8: Condensation polymerization of amino acids (Baker & Numata, 2013).
From Figure 4.8, the carboxylic acid of an amino acid reacts with the amine group of another amino acid through condensation reaction to form the polypeptide. To synthesize the polypeptide, the activation of the carboxyl group and nucleophilic attack by a free amine are required. Hence, coupling reagents, base and solvent are commonly employed as shown in Figure 4.8. After the condensation reaction between the amino acids, the resulting bonds are peptide bonds which join the amino acids together into polypeptides and subsequent form the protein-based polymer that can be used as bioplastics. This indicates that high concentration of amino acids and protein definitely favours the formation of polypeptide and hence, the protein content becomes one of the major determining factors for the transformation of fish wastes into protein-based thermoplastics.
In this work, the protein content of fish waste is important for the polymerisation of fish protein into thermoplastics. Both fish fillet and fish waste were evaluated to compare their protein content in order to understand their potential as starting material for protein-based thermoplastics. Figure 4.9 shows the experimental result of Kjeldahl analysis.
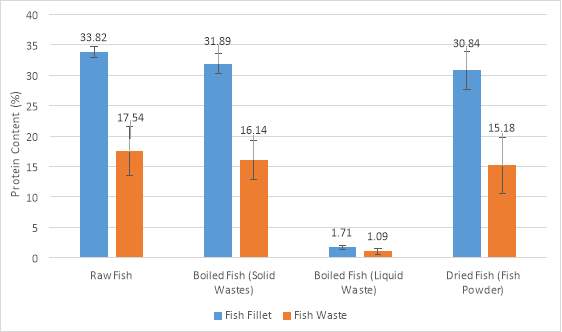
Figure 4.9: Experimental result of Kjeldahl Analysis.
In view of the result obtained, it is noted that the protein content of raw fish fillet is the highest among all the fish samples. The experimental value for raw fish fillet’s protein content is 33.82 %. This value is higher than that of Bud et al. (2008) which estimated the protein content of Mackerel fish is 17.84
±1.09 %. The difference in values is probably due to the blending process in this experiment. Bud et al. (2008) stated that fish fillet is made up of 77.46% of water and 22.54% of dry matter which is the fish muscle. The blending process reduces the water content as a lot of water is pressed out of fish fillet during blending and hence, the percentage of protein of the blended raw fish fillet increases. The high protein content of raw fish fillet is due to fact that about 70 – 80% of the fish muscle are comprised of structural proteins and another 20 – 30% are made up of sarcoplasmic proteins (Ghaly et al., 2013).
Raw fish waste has the highest protein content among all the fish waste samples. The value of protein content for raw fish waste is 17.54% which is much lower than that of Esteban et al. (2007) which claimed the percentage of protein of fish waste is 58%. However, the result agrees to the finding of Nurdiyana & Mazlina (2009) which mentioned the protein composition of raw fish waste is 16.3%. Table 4.16 shows the protein composition of fish waste (FW).
Table 4.16: Protein composition of FW (g/100g) (Nurdiyana & Mazlina, 2009).

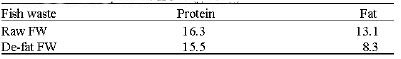
The large differences in values indicate that protein content of fish waste probably varies with different fish species and countries. Some samples of the fish wastes may have distinctively higher concentration of protein than other samples as fish wastes are made up of different non-edible fish parts such as fish heads, guts, fins and tails.
The protein content of both fish fillet and fish waste are significantly decreased to 31.89 % and 16.14% respectively after boiled. The value was less affected even after drying indicated that the protein content did not lose its properties after processing (boiling and drying).
The results also found that protein content in liquid waste is very little, lower than 2%. However, this is based on 1kg of fish. Considering that fish used in fish processing industry is large, the amount of protein in liquid waste should be significant.
Transformation of fish waste into thermoplastics requires certain additives such as a denaturing agent, reducing agent and plasticizers. These additives will disrupt the hydrogen bonding in protein, unfolded the protein structure and formed into new interactions with the help of optimum processing conditions in extrusion and compression moulding.
CHAPTER 5
CONCLUSION AND RECOMMENDATION FOR FUTURE WORKS
In this work, the ‘cradle-to-grave’ life cycle of canned fish products in this case study was analysed by LCA with particular focus on the fish waste. The LCA study was carried out in four stages, including goal and scope definition, inventory analysis, impact assessment and interpretation of result. The results of LCA in this work can be concluded as below:
- The manufacturing processes of canned fish products in this case study contributed to the high electricity consumption and production of fish processing wastes in high volume, including solid wastes and waste effluent.
- In terms of environmental impacts, the high electricity consumption and generation of fish processing wastes indirectly contributed to the impact categories of municipal solid wastes, eutrophication potential and total energy consumption which eventually lead to the rise in greenhouse effect, water pollution and global warming as well as air pollution.
- Through contribution analysis, the subsystems which were identified with greatest contributions to the impact categories of municipal solid wastes, eutrophication potential and total energy consumption were butchering, icing and retorting processes respectively.
Other than that, the waste treatment approach of Protigam Food Industries Sdn. Bhd. was also studied. Protigam Food Industries Sdn. Bhd. practises end-of-pipe treatment by utilizing Industrial Effluent Treatment Systems (IETS) for the treatment of fish processing effluent. The final products of the wastewater treatment plant are water and solid wastes which are in compliance to the Malaysian Environmental Laws.
Besides, an alternative fish waste management approach was also suggested in this work, which is to transform the protein of the fish waste into protein-based thermoplastics. Kjeldahl analysis was carried out to evaluate the protein content of fish waste. Results of Kjeldahl analysis were concluded as below:
- The fish fillet has higher protein content than that of fish waste in all kinds of fish samples, including raw fish, boiled fish and dried fish.
- Although the protein content of fish waste is slightly reduced after the processes, the leftover protein content is still considerably adequate to be polymerized into thermoplastics.
5.2 Recommendations for Future Works
There are several suggestions for the future works:
- The investigation of the LCA study are recommended to expand to larger region in Malaysia. More companies should be investigated in order to obtain more realistic inventory data to increase the accuracy of the LCA result.
- The scope of the LCA study is also recommended to be expanded to other kinds of fish products such as fish crackers and smoked fish, not only limited to canned fish products. Different kinds of fish products and their processing wastes should be included in the inventory data in order to reflect the actual conditions of the whole fish processing industry so that the reliability of the LCA results can be improved.
- The recovery of protein from fish processing industry should be done in majority of the solid waste recovery and liquid waste recovery. This will reduce the cost of wastewater treatment if the sludge could be removed at early stage of the treatment process.
Cite This Work
To export a reference to this article please select a referencing stye below:
Related Services
View all


Related Content
All TagsContent relating to: "Food and Nutrition"
Food and Nutrition studies deal with the food necessary for health and growth, the different components of food, and interpreting how nutrients and other food substances affect health and wellbeing.
Related Articles

DMCA / Removal Request
If you are the original writer of this dissertation and no longer wish to have your work published on the UKDiss.com website then please: