Has the Expansion of the Panama Canal Influenced the Competitiveness of ULCV Vessels?
Info: 11103 words (44 pages) Dissertation
Published: 10th Dec 2019
Has the expansion of the Panama Canal influenced the competitiveness of ULCV Vessels?
 Source: Pulse, 2016
Abstract
In 2006 the Autoridad del Canal de Panamá (ACP) announced the project to expand the Panama Canal, this was completed last year and officially opened on the 26th June 2016. The purpose of this dissertation is to establish if due to the expansion, there has been a change in the competitiveness of Ultra Large Container Vessels, specifically between the new Panamax vessels at the bottom end of the bracket, and the largest of the bracket. In order to reach the most accurate conclusion possible, formulas breaking down the varying cost per TEU container will be calculated. In addition, there is a chapter on the analysis on the current global containership market, and various discussions that may influence the competitiveness.
Table of Contents
Chapter 1. Introduction………………………………………..
1.1 Background…………………………………………….
1.2 Aim and objectives……………………………………….
Chapter 2. Literature review……………………………………
2.1 The 1900’s Panama Canal………………………………….
2.2 Panama Canal expansion…………………………………..
2.3 Cause and Effect of the expansion…………………………….
2.3.1 Challenges…………………………………………..
2.3.2 Solutions……………………………………………
2.3.3 Logistic issues………………………………………..
2.4 Port expansion………………………………………….
Chapter 3. Literature Review……………………………………
Chapter 4. Data………………………………………………
4.1 Route…………………………………………………
4.1.1 Time at Sea…………………………………………..
4.1.2 Time in Port………………………………………….
4.2 Variables………………………………………………
4.3 Operating Costs…………………………………………
4.4 Voyage Costs……………………………………………
4.4.1 Fuel Costs……………………………………………
4.4.2 Port & Cargo Costs……………………………………..
4.4.3 Canal tolls…………………………………………..
Chapter 5. Analysis……………………………………………
5.1 Variable scenarios……………………………………….
5.1.1 Speed Variable………………………………………..
5.1.2 Load Variable…………………………………………
5.1.3 Bunker Variable……………………………………….
5.1.4 TEU Variable…………………………………………
5.2 Summary………………………………………………
Chapter 6. Discussion………………………………………….
6.1 Trade lanes…………………………………………….
6.2 P3 Alliance…………………………………………….
6.3 Environmental effects…………………………………….
Chapter 7. Concluding remarks………………………………….
References………………………………………………….
Appendices………………………………………………….
Appendix 1…………………………………………………
List of Figures
Figure 1: SS Ancon beginning the first official transit in 1914………………..11
Figure 2: A view of the Expansion project.……………………………………..12
Figure 3: Intermodal transportation procedure.………………………………..18
Figure 4: Consumption calculations.…………………………………………….25
Figure 5: MSC Paloma.…………………………………………………………..27
Figure 6: Majestic Maersk.………………………………………………………..27
List of Tables
Table 1: Cargo Handling Costs………………………….………………..……..25
Table 2: Suez Canal Toll……………………………….………….……………..26
Table 3: Vessel Overview……………………………….………………………..28
Table 4: Speed Sensitivity………………………………………………………..29
Table 5: Load Sensitivity…………………………………………………………..30
Table 6: Bunker Sensitivity……………………………………………………….31
Table 7: TEU Sensitivity…………………………………………………………..32
Table 8: TEU Sensitivity Graph…………………………………………………..33
List of Appendices
Appendix 1: Screenshot of excel equation……………………………………..45
Appendix 2: Dissertation and excel equation on CD…………………………..46
Chapter 1. Introduction
1.1 Background
The Panama Canal is the connection point between the Atlantic and Pacific Oceans, and has been a vital shipping route over the course of the last 100 years, making trade between the East and West significantly easier.
Understandably, over time, shipbuilders have built larger and larger vessels so that the maximum amount of cargo can be transported on each voyage. This then meant that the vessels were eventually designed to only fit within a few feet of the canal walls. To continue expanding their businesses, container shipping companies with larger vessels sought out alternative routes so they could avoid the constricting Panama Canal.
Due to the aforementioned paragraph and other factors the Panamanian government decided to expand the Canal in 2006 with a planned completion date of December 2015. After the announcement, questions were raised regarding the impact that it would have on; trade flows and volumes, competition between the Panama Canal and alternative routes, and the changes that Shipowners would make to their routes.
1.2 Aim and objectives
The overall aim of this project is to establish whether or not the recently completed Panama Canal expansion has impacted the competitiveness of different Ultra Large Container Vessels (ULCV), specifically the new Panamax vessels (NPX) and the largest ULCV vessels.
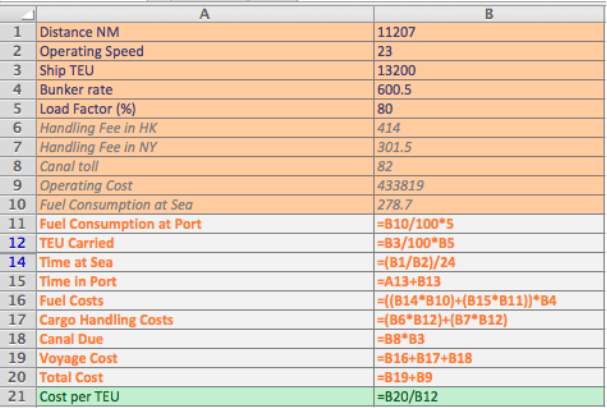
This will be tested by using a specially made Microsoft excel equation I have designed [Appendix 1], along with data on the current and future predictions of the shipping container market.
Different variables will be ran through the equation so that multiple sensitivity scenarios can be showed clearly in a table format and analysed.
Chapter 2. Literature review
2.1 The 1900’s Panama Canal
The first vessel to ever use the Panama Canal was a small French crane boat ‘Alexandre La Valley’ on the 7th of January 1914, while the canal was still under construction.
The Canal first started construction under the French in 1880 and was later completed by the United States fifteen years after they took control in 1899. The total cost for the project was around $375 million and claimed over 25,000 lives during the removal of nearly 300 million cubic meters of mass.
The grand opening for the Canal was originally planned for August 1914 but due to the start of World War 1 on the 28th July the ceremony was cancelled. The first official vessel to utilise the Canal was the SS Ancon, two weeks after the proposed opening (ACP, 2014)
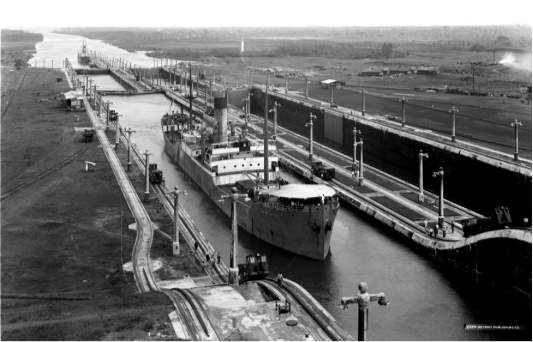 After first opening in 1914 the Panama Canal has become one of the most popular passages for global trade, with a total of 12,045 vessels passing through in 2013 (ACP, 2013). The result of the Canal has inspired 140 trade routes going to over 80 countries. The majority of the trade occurs on the East – West passage, which dominates the container business (Stopford, 2009).
Figure 1: SS Ancon on the first official transit in 1914 Source: Rctom, 2016
2.2 Panama Canal expansion
The Autoridad del Canal de Panama (ACP) listed four primary objectives in their original expansion plan (ACP, 2006):
- Make the Canal safer, more efficient, and more productive
- Maintain the Canals competitiveness as well as the value added by Panama’s maritime route to the national economy
- Increase the Canals capacity to accommodate the growing tonnage demand with a corresponding increase in the levels of service of each market
- Achieve long-term sustainability and growth for the Canals contributions to the Panamanian society though the payments it makes to the National Treasury
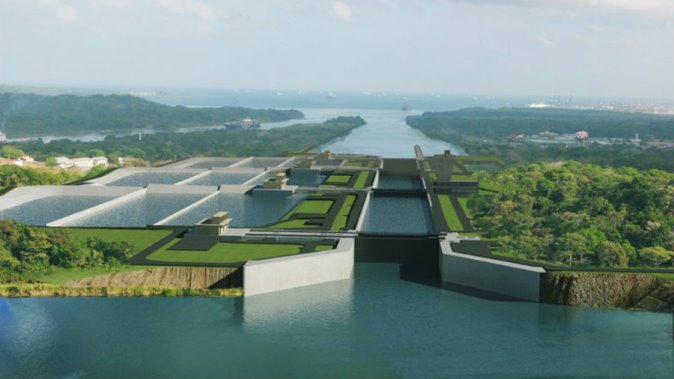
 Figure 2: A view of the expansion project. Source: LA Times, 2014.
The expansion project as a whole is usually called the ‘third set of locks project’ and is made up of smaller projects each expanding a certain area of the Canal:
- The deepening and widening of the Canal entrance at both the Atlantic and Pacific sides
- The widening and deepening of the navigation channel at both the Culebra Cut and Gatun Lake
- The construction of a new access channel on the Atlantic side
- The raising of the Gatun Lake water level so as to accommodate larger vessels
- Four dry excavation projects so that the Pacific locks and the Culebra Cut can be connected with a newly built 6.1 kilometre access channel.
2.3 Cause and Effect of the expansion
When the expansion of the Panama Canal was first discussed, it inspired hundreds of articles and pieces of literature to be written on the possible effects that the expansion would have on businesses, ports, and economies around the world. Many of these articles focused on the effects that the expansion would have on ports, and how some ports were ready to handle visits from larger vessels, while others would be unable. Ports such as Baltimore in Maryland, and Hampton Roads in Virginia have been able to handle vessels that have the ability to navigate around Cape Horn for quite a while, so they will have no problems when accommodating the New Panamax (NPX) vessels.
Ports authorities across both the East and West coasts of the Panama Canal, and around the globe have been making land purchases and signing new contracts, with the hope to increase the operations and capacity of their ports. This is because they are expecting that, in the long run, business will return and the expansion will help them keep ahead.
Ports that do not currently have the means to fund their own expansion are looking at privatization as a solution, due to the shift from West coast to East coast ports (Dupin, 2009)
The port of New York will always be vital because of the enormous population it serves, even if it does not have the ability to handle NPX vessels because of the height restrictions on the Bayonne Bridge (Dupin, 2009)
The reason so many ports will struggle with the new NPX vessels is that their draft exceeds the depth. Each authority will have to analyse whether or not it will be worth the initial cost of dredging the channels, and purchasing large NPX cranes to handle the larger vessels and their cargo (Dupin, 2006).
The CSX Corporation and Norfolk Southern Transportation have provided funding to expand and improve the Intermodal route. Their National Gateway and Southern Heartland Corridor projects were started with the aim of allowing double-stacked trains to reach the United States Midwest quickly. This has, in turn, caused an increase in distribution centres, which has made it more expensive to do business on the West coast. Due to this increase in cost to do business using the Intermodal route, businesses may find it more cost efficient to ship the freight to the East coast and Gulf coast (Dupin, 2009).
Some analysts have speculated that in addition to the construction of distribution centres on the East coast and Gulf coast, the change in population densities, and the increase in rail costs, it will have a positive impact on the East coast ports over the next ten years (Miller, 2008)
Researchers also believe that with the addition of larger fleets and vessels, and the flourishing economy in Asia, the East coasts ports are likely to have larger vessels arriving via the Suez Canal (Dublish, 2005).
2.3.1 Challenges
Other than the literal restrictions for larger vessels on ports and canals, there are a few external factors that are shaping the future of shipping. Some recently published reports have come to the conclusion that there could be a shift in manufacturing from North East China to Western India. If this is the case it will mean New York is 3,308 nautical miles closer via the Suez canal, over the Panama canal (Knight, 2008).
Ports in both Long Beach, and Los Angeles are becoming more and more ‘boutique’, which is driving, imports to the region through the Panama canal (Miller, 2008).
The deepest port in the Bahamas (Freeport) has the potential to become a hub for the NPX vessels, as they will have the ability to unload their freight so it can get transferred to smaller vessels, heading for ports in the US that cannot accommodate NPX vessels. If this becomes a popular way to transport cargo to the United States, it would mean ports across the US coastline would not need to dredge or deepen their channels as much as originally thought (Knight, 2008).
2.3.2 Solutions
There are still unknowns about the effect the Panama canal expansion will have on global shipping, other than the depths of ports. Analysts and port authorities are concerned that it is not the size of the NPX vessels that will cause ports to struggle, but the increase of maritime traffic (Knight, 2008). Researchers are also concerned that if the Panama Canal tolls become too high, vessels will choose to use the Suez Canal instead (Knight, 2008).
The third and most vital concern that researchers have raised is the readiness of current East coast and Gulf coast ports. It is predicted that even up to ten years after the expansion, the majority of ports will still not have the ability to properly host NPX vessels.
If these ports wish to accommodate the larger size of vessels, significant investment in infrastructure needs to occur.
The largest of these investments will be; longer docks, deeper channels, an increased storage area, and the logistical equipment to move cargo from the ships to both railways and lorries (Knight, 2008).
2.3.3 Logistic issues
In addition to requiring deeper water, longer docks, and rail facilities on the dock, the sheer increase in container numbers means that they will be stacked higher and wider, this means that more cranes will have to purchased and they will need to be of a larger size (McCray and Gonzalez, 2007).
The newer, larger cranes can cost between $9,000,000 and $11,000,000 and the acquisition of more land can be very dear, or not even possible. The deepening of port channels can be a lengthy process, the port authorities have to file permits, quote dredgers, and have environmental studies conducted (McCray and Gonzalez, 2007)
If the ports that planned on handling NPX vessels did not start to invest when the expansion first commenced or in the previous five years, it is unlikely they will be able to accommodate them for several years to come.
2.4 Port expansion
The full impact that will occur to the East coast and Gulf coast ports is still not completely known. One researched stated “Enlarging the Panama Canal will be one of the most significant logistical ‘Game Changers’ in U.S. shipping history, providing East Coast ports positioned to handle larger ships an economic windfall” (Abt, 2008). The crucial part of this statement is “ports positioned to handle larger ships”. The fact that so many ports need to make serious investments to handle NPX vessels is the most limiting factor on how much of an “economic windfall” there will be (Abt, 2008).
The ports that wanted to take advantage of the economic windfall when the extension project first started outlined their plans to increase both the volume and the size of the vessels they are able to handle.
“Besides increased dredging, the most frequently mentioned plans were investments in rail yard expansion and electric freight handling equipment and larger greener warehouses” (Abt, 2008).
There are four main ports on the East coast that expanded to accommodate NPX vessels: Jacksonville, Florida; Portsmouth, Virginia; Savannah, Georgia; and Charleston, South Carolina (Carey, 2006).
A lecturer, Tom Mentzer, at the University of Tennessee, a specialist in maritime logistics wrote a report stating “Charleston, Savannah, and Jacksonville will be in a good position to expand, because the West Coast ports will be operating near capacity after 2010”
Tom Mentzer is not the only individual to publish a report about the effects of the Panama canal expansion, an article by ‘Traffic World’ wrote “The ports of New York, New Jersey, Savannah, Charleston, and Virginia are going to benefit, while smaller ports such as Philadelphia, Baltimore, Wilmington, and Boston are poised to becoming niche ports, rather than compete with bigger ports” (Dublish, 2005).
Chapter 3. Literature Review
Since the expansion of the Panama Canal was first announced on 24th April 2006, there has been an increase in the production and use of ships and vessels with a higher TEU capacity. There are several reasons for this, one of which is due to the cost efficiency of carrying more containers per vessel.
Another industry growth that has positively impacted the use of larger TEU carrying vessels is the Intermodal transportation procedure. This benefits larger vessels because the cargo and goods inside the containers never need to be unloaded or reloaded until they reach their final destination. The large steel containers can change to different modes of transportation like railways, waterways, and roadways. This coupled with the increasing use of refrigerated cargo containers, which control and maintain cargo temperature enable the transport of fresh produce, meat, and medicine.
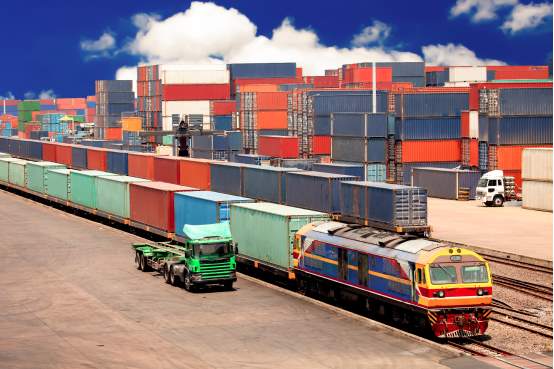
Figure 3: Intermodal transportation procedure Source: Info.plslogistics.com, 2017
Container lines are also using more advanced specialist analytic programs to aid with; the deployment of their shipping fleet, the optimum use of the containers, and the logistics of operations all over the globe. These specialist analytic programs use current market trends, and forecast industry changes both short and long term to provide the most accurate information.
A study conducted by the Transparency Market Research group in 2016, stated that the global container fleet market had a value of $8.81 billion, but is expected to reach $14.41 billion by the end of 2025 – and increase of 63.5%. This shows that if the container market continues to grow as quickly as predicted, there will be a compound annual growth rate (CAGR) of 5.7% between 2017 and 2025. (Transparent Market Research, 2017)
This study also reported that AP Moller – Maersk, Mediterranean Shipping Company, CMA CGM, China Ocean Shipping, Evergreen Marine, and Hapag Lloyd occupy 58.3% of the global container market.
The study concluded by stating that the Asia Pacific region (holding a dominant market share of 35.2%) will likely continue to remain the leading segment till 2025. (Port Technology, 2017)
There are five regions that make up the global container fleet: North America, Latin America, Europe, Middle East and Africa, and Asia Pacific. Of these five regions, North America and Asia Pacific account for over 50% of the total market revenue generated in 2016.
Even though the North America generated the second largest market revenue in 2016, Europe is predicted to have the second highest CAGR between 2017 and 2025 followed by North America, Middle East and Africa, and Latin America.
Along with being segmented into geographical regions, the container fleet is also divided up into the various containers that can be carried on the vessels: Dry, Reefer, and Tank. In 2016 the largest market share was held by the Dry container segment, however, Reefer containers are forecasted to be the fastest growing area between 2017 and 2025. Dry containers will continue to have the largest market share though because they draw demand from all the major industries with their ability to transport a wider variety of goods.
For two years prior to the expansion of the Panama Canal, excess capacity had depressed freight rates on all passages and trade lanes. The capacity bounced back after the collapse of the Hanjin shipping company.
In a report conducted by the shipping company Maersk, they stated that the new deliveries of container vessels towards the end of 2015 were likely to damage the container shipping industry. They also stated that any more deliveries made in 2016 would add to overcapacity found in the industry.
As a result of this report and the future projections for the industry, there was a record number of vessels being scrapped towards then end of 2016. Maersk themselves scrapped eight of their old Panamax vessels, possibly due to the realization that they would no longer be of great use.
A total of 934,000 TEUs (136 vessels) were delivered and 665,000 TEUs (201 vessels) were scrapped during 2016. The ULCV vessel class thrived in 2016 with vessels up to 21,100TEU being produced. It is predicted by 2019 the ULCV fleet could grow by up to 85 per cent with more of the smaller and midsize vessels being scrapped.
In 2008 the average scrapping age for most container vessels was 30 years the highest ever seen in the industry, but in 2016 that had declined rapidly to an average of 19 years.
The data-recording specialist ‘Vessels Value’ said that they had seen discounts of almost 50% for old Panamax vessels, along with a high number of old Panamax vessels being scrapped.
Vessels Value also reported that the average age of container vessels that were sent to scrap had gone from an average of 22.2 years in 2015, to 18.2 years in 2016.
At the end of 2016 only thirteen old Panamax vessels were on order, which is staggering compared to the 137 ULCV vessels on order.
In 2006, when the expansion of the canal was first announced, only two ULCV vessels had been delivered totalling 1% of the global fleet.
Chapter 4. Data
4.1 Route
4.1.1 Time at Sea
 In order to calculate the duration of time (in days) the vessels will spend at sea, a simple formula has been used.
The breakdown of this formula is as follows; TS represents the total travelling time in days, D is total distance travelled in nautical miles, and V is the average speed of the vessel in knots. This side of this equation is then divided by 24 hours in order to get the total time spent travelling in days.
4.1.2 Time in Port
The usual method used to calculate the total time spent in port relies on several different factors, which were broken down in a 2013 report. (Harries et. al., 2013):
- Actual distribution of TEU containers on board
- Container slots scheduled for loading and unloading in all ports visited
- Time spent waiting for the availability and utilization of container cranes
- Speed and equipment of cranes (e.g. spreaders)
- On-shore handling of containers and what they are being transported to (intermodal)
- Time needed for manoeuvring and mooring the vessel
- Delays due to wind and waves in port (causing container swaying and ship motion)
- Possible idle times (e.g. waiting for availability of special equipment and personnel)
Another factor that needs to be considered is the amount of cargo the vessel is due to load or unload at every port on the vessels passage. Usually a vessel will stop at several ports throughout its passage to make the most cost efficient voyage possible. However, in the scenario used for the sensitivity tests, all the cargo will be loaded at the start port (Hong Kong), and unloaded at the finishing port (New York). Since the total time the vessel will be spending in port is directly related to the amount of cargo the vessel is scheduled to carry on the passage, the entire time spent in port calculation will be based on the average berth productivity per hour. This data has been gathered from a research paper on port productivity by the Journal of Commerce, (2013) and is displayed as the total TEU containers the port is able to load / unload, on average, every hour.
The more efficient the port becomes, whether it is achieved by working round the clock, or increased labour force, the higher the berth productivity per hour becomes. Also, the scenario used in the next chapter for the sensitivity tests, it will be assumed that both ports will be running around the clock, 24 /7. It will also be assumed that any administration work that may be conducted by the port will be carried out during the loading / unloading operations so that no unnecessary time is lost while in port.
The average berth productivity per hour in the Asian ports is shown to be amongst the ten most productive in the world with Hong Kong having a rate of 68 TEU containers per hour. This is then surpassed by Shanghai – 86 TEUs per hour, Shenzhen – 75 TEU’s per hour, and Guangzhou – 73 TEUs per hour.
The average berth productivity in US ports is significantly lower at 52 TEUs per hour for Los Angeles and New York.
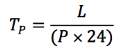 The formula used to calculate the time spent in port is as follows:
The breakdown of this formula shows that TP represents the time spent in port, L is the amount of containers loaded or unloaded to the vessel, and P is the average berth productivity per hour. The per hour productivity is then multiplied by 24 hours to get the duration of time in days.
4.2 Variables
The bunker prices for the vessels fuel have been gathered from Ship and Bunker (2016) and Bunker World (2016). The prices can differ dramatically depending on what ports the vessels choose to refuel at. Regarding the scenario, the bunker price will remain constant at $600.50, with an exception to the bunker sensitivity test where the costs will be different.
4.3 Operating Costs
The data used for the vessels operating costs has been gathered from the most recent source that could be found at the time this project was written. The Drewry Annual Report for Ship Operating Costs (2013) breaks down the average daily cost for different vessel size categories.
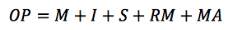 The formula used for calculating the daily operating costs is:
The corresponding cost contributing to the operating costs is represented here with OP as operating costs, M as manning, I as insurance, S as stores, spares and lubricating oils, RM as repairs and maintenance, and MA as management and administration.
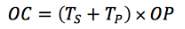
In order to get the total operating cost (OC) it requires an additional formula so it can take into account the total amount of days the vessel the vessel spends at sea, and in port on the duration of its voyage:
4.4 Voyage Costs
The end formula used to work out the total cost of the voyage can be calculated by using the following formula:
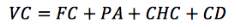
The breakdown of this formulas is established shows that VC represents voyage costs, FC is fuel costs, PA is port administrative fee, CHC is cargo handling costs incurred during the loading and unloading of containers, and CD stands for canal dues which differ depending on which canal is used.
This basic formula is a simplified version of one of the formulas written in Chapter 6 of the 2009 3rd Edition of Maritime Economics by Martin Stopford.
4.4.1 Fuel Costs
To obtain the most accurate fuel costs for the formulas and sensitivity tests, the table below showing the increase in TEU capacity, with the correlating increase in fuel consumption with regard to the vessels speed was used. Notteboom and Carriou wrote this table for a conference to the International Association of Maritime Economists in 2009 about the Fuel surcharge practices of container shipping lines.
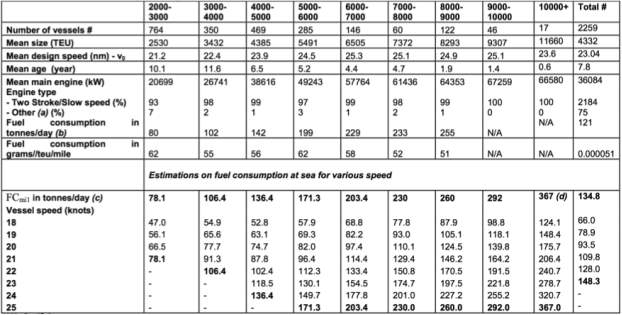
Figure 4: Consumption calculations Source: Notteboom & Carriou, 2009
The reason this table was used to get the most accurate fuel consumption calculations was because it is based on 594 observations making it a very reliable source of data.
 The total fuel cost calculations are worked out by using the formula below:
The meaning of each component in this formula is as follows, where FC is total fuel costs, TS is days spent at sea, FS is fuel consumption at sea measured in tonnes per day, TP is days spent in port, FP is fuel consumption in port, also measured in tonnes per day, and P is fuel bunker price per metric tonne.
As displayed above, the fuel consumption at sea is shown in the table. Due to both the vessels in the scenario being above 10,000 TEU and having the same operating speed of 23 knots, the average fuel consumption for both will be 278.7 tonnes per day.
It is understandable that the vessels would not be consuming as much fuel when stationary in port compared to when underway at sea. To account for this difference in consumption, the fuel used in port will be calculated as 5 % of the total fuel used at sea.
4.4.2 Port & Cargo Costs
The table below was created to clearly show the different costs each port demands for the handling of cargo (CHC). The data used for this table was gathered from a report written in 2009 by the European Commission on Handling Charges.
Table 1: Cargo handling costs
| Port | Handling Fee | Exchange Rate | In USD |
| New York | $ 414.00 | 1 | $ 414.00 |
| Hong Kong | 2,347.00 $ | 0.128460 | $ 301.50 |
The Hong Kong Exchange rate information was accurate on the 9th May 2017 and sourced from XE.
4.4.3 Canal tolls
The canal toll (CD) charged by the Panama Canal authority is stated on the Panamanian canal authority website (ACP, 2014). It is based on a simple format that each TEU container carried on the vessel carries a fee of $74, and if the TEU container is loaded with cargo it incurs an additional cost of $8. Additionally, if a vessel was to carry TEU containers as ballast it comes with a cost of $65.60.
Unlike the Panama Canal, the Suez Canal bases their toll on the total weight of the vessel. A calculator can be found on the Suez Canal Authority website (SCA, 2014), but a simpler resource that can be used is a table written by Notteboom and Rodrigue in the magazine Port Technology International (2011). This table is better suited for the scenario and sensitivity tests because it has been formatted to the total TEU capacity of the vessel. If a passage were to be planned, it is required that the vessel uses the calculator and provides records of all the relevant container documentation.
| TEU Capacity | Canal Transit fees | Per TEU Average |
| 3,000 – 3,999 | $ 221,403 | $ 73.80 |
| 4,000 – 5,999 | $ 271,939 | $ 67.98 |
| 6,000 – 7,999 | $ 373,589 | $ 62.26 |
| 8,000 – 9,999 | $ 455,770 | $ 56.97 |
| 10,000 – 12,999 | $ 536,782 | $ 53.68 |
| 13,000 – 17,999 | $ 654,455 | $ 50.34 |
| 18,000+ | $ 851,798 | $ 47.32 |
Table 2: Suez Canal toll
Chapter 5. Analysis
 The competitiveness between the New Panamax vessel and the larger Ultra Large Container Vessel will be gauged through a series of sensitivity tests using the same scenario. The sensitivities tested will be a series of variables that affect the total cost per TEU on a voyage between Hong Kong and New York.
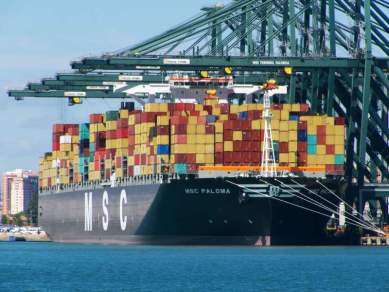
Figure 5: MSC Paloma Source: Shipspotting.com, 2017
MSC Paloma is the model being used as the new Panamax vessel (NPX), which is the largest ship category that is able to fit within the locks since the expansion. It has a capacity of 13,200 TEU (Twenty-foot Equivalent Unit).
Figure 6: Majestic Maersk Source: Guexed.com, 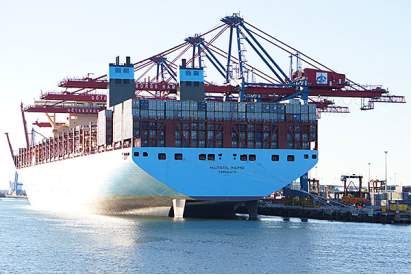 2017
2017
The vessel taking the role of the ULCV (Ultra Large Container Vessel) is the Majestic Maersk, which has a capacity of 18,270 TEU and is the second largest container ship in the world (Vessel Tracking, 2017). Due to the size of the ULCV class it is unable to sail through the Panama Canal.
As the analysis will be using two fully operational vessels, the correct speed specifications will be used to keep the scenario as accurate as possible – 23 knots for Majestic Maersk, and 23 knots for MSC Paloma. The other variable that will be controlled is the maximum load factor, which will be capped at 80%.
Table 3: Vessel overview
| Vessel | TEU-capacity | DWT | GT | Length (m) | Beam (m) | Draft (m) | Speed (knts) | Build year |
| MSC Paloma | 13,200 | 165,500 | 153,092 | 365.5 | 51.2 | 15.5 | 23 | 2010 |
| Majestic Maersk | 18,270 | 194,431 | 194,849 | 399.9 | 59 | 14.5 | 23 | 2013 |
The reason this will show the competitiveness between the two vessels is because the final graph shows the changes in cost depending on the vessels TEU capacity. It will be possible to distinguish the margin between the previous Panamax and ULCV vessels, and how the expansion has decreased that competitive margin with the accommodation of the new Panamax vessels.
5.1 Variable scenarios
5.1.1 Speed Variable
One of the more significant variables that was altered in the range of scenario competition tests was speed. In all the other scenarios the speed remains a constant at the vessels operating speed. The reason for altering the speed of both vessels is to see if either could be optimized and at what speed the vessels could hold the smallest cost and duration at sea margin.
From the table below it is possible to see that with both vessels travelling at the set speed of 23 knots the Majestic Maersk has a reduced cost per TEU by $8.22 but will take 0.7 days longer to complete the trip. For the Majestic Maersk to complete the voyage in a more similar time to Paloma it would need to set a speed of 24 knots. The downside to this is that is that it would increase the cost per TEU to $26.51 more than the Paloma. From this it is obvious that that slight reduction is days spent at sea compared to the substantially larger increase in cost would not be cost efficient for the Majestic Maersk.
If Paloma were to reduce its speed to 22 knots it would be able to reduce the cost per TEU to $24.64 less than the Majestic Maersk, and only have a time difference equal to what the Majestic Maersk currently has on the set 23/23-knot scenario.
| MSC Paloma – Panama | Majestic Maersk – Suez | |||
| Speed | Cost per TEU | Days at Sea | Cost per TEU | Days at Sea |
| 18 | $ 1,047.42 | 25.94 | $ 1,039.69 | 26.84 |
| 19 | $ 1,072.78 | 24.58 | $ 1,064.96 | 25.42 |
| 20 | $ 1,099.54 | 23.35 | $ 1,091.91 | 24.15 |
| 21 | $ 1,128.83 | 22.24 | $ 1,120.82 | 23.00 |
| 22 | $ 1,159.82 | 21.23 | $ 1,151.71 | 21.96 |
| 23 | $ 1,192.68 | 20.30 | $ 1,184.46 | 21.00 |
| 24 | $ 1,227.52 | 19.46 | $ 1,219.19 | 20.13 |
| 25 | $ 1,264.47 | 18.68 | $ 1,256.02 | 19.32 |
Table 4: Speed sensitivity
Ultimately this boils down to how many days the vessel operators are willing to sacrifice in order to reduce the total voyage cost. This table also shows that the changes that could be made to the passage regarding the speed of both vessels would provide neither one with a significant advantage or increase competition.
5.1.2 Load Variable
The table below shows the difference a change in load factor would make on the cost per TEU of both vessels.
| MSC Paloma – Panama | Majestic Maersk – Suez | |
| Load | Cost per TEU | Cost per TEU |
| 55% | $ 1,404.20 | $ 1,226.02 |
| 60% | $ 1,347.79 | $ 1.184.46 |
| 65% | $ 1,300.06 | $ 1,149.30 |
| 70% | $ 1,259.15 | $ 1,119.16 |
| 75% | $ 1,223.70 | $ 1,093.03 |
| 80% | $ 1,192.68 | $ 1,070.18 |
Table 5: Load sensitivity
These results show that the load factor has the most significant effect on the cost per TEU. Load factors can vary massively depending on the size and weight of the vessel, with larger ULCV vessels depending on high demand in order to keep a similar cost with other vessels that carry an 80% load.
For example, if Paloma were to carry an 80% load totaling 10,560TEU along the Panama Canal, the Majestic Maersk would need just under a 60% (10,962TEU) load factor to keep competitive. Even with a difference of 20% load factor the likelihood that a ULCV vessel is unable to keep competitive is unlikely, this is because of the negligible difference in the TEU containers the vessels would carry at their respective load factors of 80% and 60%.
However, if a full cost round trip scenario was introduced, the freight rates on a return journey could show that a vessel of a certain size may be more economic, depending on the load factor.
5.1.3 Bunker Variable
The table below provides a look at how the competition between the two vessel sizes on each of their routes may change if the bunker prices were to alter.
| MSC Paloma – Panama | Majestic Maersk – Suez | |
| Bunker price | Cost per TEU | Cost per TEU |
| $ 400 | $ 1,081.29 | $ 1,073.45 |
| $ 600 | $ 1,192.40 | $ 1,184.18 |
| $ 800 | $ 1,303.51 | $ 1,294.91 |
Table 6: Bunker sensitivity
From this test it shows that if there were a change in bunker price for both vessels it would not cause either to claim an advantage. There is an equal difference of $0.38 between the two cost per TEU averages; this shows that the vessels are too similar for their competitiveness to change depending on the prices.
5.1.4 TEU Variable
| Vessel TEU | Cost per TEU |
| 5,000 | $ 1,278.85 |
| 6,000 | $ 1,265.98 |
| 7,000 | $ 1,247.75 |
| 8,000 | $ 1,239.36 |
| 9,000 | $ 1,263.24 |
| 10,000 | $ 1,219.66 |
| 11,000 | $ 1,265.25 |
| 12,000 | $ 1,228.96 |
| 13,000 | $ 1,198.26 |
| 14,000 | $ 1,281.31 |
| 15,000 | $ 1,271.95 |
| 16,000 | $ 1,243.16 |
| 17,000 | $ 1,217.75 |
| 18,000 | $ 1,190.13 |
| 19,000 | $ 1,169.93 |
| 20,000 | $ 1,151.74 |
Table 7: TEU sensitivity
This final sensitivity test shows the changes in the cost per TEU depending on what the vessel TEU capacity is. It has been displayed in both table form (above) and as an annotated graph (below). With every increase in vessel capacity five variables could change; The canal tolls change when the vessel size exceeds the capacity of the Panama Canal, the operating costs increase three times for when the vessel reaches a new size bracket, fuel consumption increases every time the vessel TEU capacity increases until it exceeds 10,000TEU, the load factor decreases once the vessel exceeds the Panama Canal and starts using the Suez Canal, and the distance also increases when the vessel exceeds the Panama Canal and has to travel along the Suez Canal.

Table 8: TEU sensitivity graph
5.2 Summary
From the above graph it is clear that the two vessels used for the scenario and comparison do compete with each other but not to the detriment of either vessel class. As seen from the dashed blue line they have an almost identical cost per TEU value.
Then vessels that will struggle most to compete with the new Panamax vessel class and the ULCV vessels will be vessels that only just exceed the new Panama Canal expansion. These vessels fill not specialty in the container shipping market, unlike the NPX, which holds that title of the largest vessel class able to navigate the Panama Canal, and the top end of the ULCV class, which are some of the largest vessels in the world and due to their size can carry a vast number of containers and remain cost efficient.
Chapter 6. Discussion
6.1 Trade lanes
In 2013 the financial website Forbes wrote an article titled ‘The Logistics and Impacts from Widening the Panama Canal’. It opened by discussing how the North America to Asia trade lanes relied on the ports of Los Angeles and Long Beach, and with the ever-increasing use of intermodal transport, a high proportion of cargo can now reach the Midwest and East coast. Forbes correctly predicted that intermodal transportation procedure would continue to grow and benefit from the Canal expansion.
One of the largest infrastructure investments made that has strengthened the US trade lanes was the Bayonne Bridge in New York harbour. The Port of New York spent $1.3 billion to raise the Bayonne Bridge to 64 feet so that the port can accommodate the greater size of the new Panamax vessels.
In addition to the benefits the North America to Asia trade lane will see the expansion will also better the economics of shipping from eastern Latin America to Asia. The Forbes article concluded by saying that there is an opportunity for a new triangular trade lane to form: Consumer goods from Asia to North America, higher end consumer goods and pharmaceuticals from North America to South America, then finally coal and iron ore can be exported from Columbia, Venezuela, and Brazil to Asia. (Forbes, 2013)
6.2 P3 Alliance
Back in 2014 a large-scale alliance was in motion between the three largest carriers in the world, Maersk, MSC, and CMA. It needed to go through three regulators and reach a unanimous outcome. It got so far as to be approved by the US regulators, and the European Commission, but the alliance came to a standstill when the Chinese Ministry of Commerce made the decision to disapprove. The reason China prevented the alliance was because they considered it a merger, and it didn’t follow China’s merger control rules. (Shipping Watch, 2014)
If this alliance had gone forward it would have changed the outcome of all the sensitivity and scenario tests. The alliance between the three companies would have allowed them global control of the freight rates so that they could be inflated / deflated enabling all their costs could be covered. In addition to this, the logical step the P3 carrier group would have taken would be to sail the largest possible ships with the highest possible load factors. This would then make the Suez Canal the preferred option when on a trade lane between North America and Asia due to the reduced canal fees.
6.3 Environmental effects
One of the benefits of the Panama Canal expansion will be the reduced carbon footprint of the shipping industry. If the predicted increase of larger capacity vessels continues, it will lead to a reduced CO2 footprint per TEU container. As well as the cost efficiency the use of larger vessels will bring, newer vessels, like the 137 ULCV vessels on order, are likely to incorporate newer technology and designs to increase the fuel efficiency.
Although, if both the scenario vessels CO2 emissions per TEU are compared, the Majestic Maersk will be preferred over MSC Paloma, which could lead some charterers to favour a larger vessel on the Suez Canal. However, the MSC Paloma could also take preference given that the Asia to America route through the Panama Canal is shorter and could result in less pollution.
Chapter 7. Concluding remarks
Due to the expansion of the Panama Canal new areas of the container market have started to grow and develop, all of which aid in feeding the demand needed for the ULCV class to accommodate the various vessel sizes it encompasses.
Unforeseen changes in the cargo container market may demand that shorter passages are needed in the future. This would then show preference the remaining old Panamax vessels, and smaller vessels that have the ability to shorten their route by using the Panama Canal.
Even though only one passage scenario was run, if the trade lane start and end ports were different – impacting the bunker prices, voyage costs, port fees, and cargo handling, the sensitivity tests would likely present similar findings to this project, showing that the competitiveness is not a danger to either size. This also true for the singular route alternative used for the Majestic Maersk, yes, the results could have been more varied if a route around the Cape of Good Hope was used, and it is definitely something to be considered in future projects.
With regard to the change in trade lanes and the two vessel sizes, the new Panamax vessel would have an enormous advantage over ULCV vessels if utilising the triangular trade lane. The reason for this is because of the proximity the Panama Canal is to South America and that the ULCV would be travelling through the Suez Canal. Even with this advantage the larger ULCV vessels would not be out competed due to the range of other trade lanes available, variation of containers that can be transported, and the continued scrapping of smaller TEU capacity vessels that will no longer be lowering the demand.
Future changes made to the canal tolls by the representative authorities could impact the vessels in positive or negative ways. Unless there was a dramatic change in costs both vessels would continue to remain within friendly competition of each other.
At the time of this project being conducted the exchange rate did not dramatically affect the port and cargo costs at either end of the voyage. This is perhaps the most frequently changing variable so similar projects conducted in the future may obtain different results.
One of the first concerns had relating to this project was that if political orders were changed and enforced, then the type of cargo being transported on the scenario route could decline, causing the vessels load factor to decrease.
As a current example, if President Trump decided stop the import of Chinese made products in the hope of creating jobs for Americans to make American products.
Even though this would dramatically change the cargo type and load of all vessels on a passage to North America, it would have equally negative effects on all vessel sizes and would show no bias.
Obviously there have been limitations to the project both in the data collected, and in continuously changing variables but overall, the data shows that even though both vessel sizes compared in the scenario do compete with each other, it is of no detriment to either vessel, thereby reinforcing the original hypothesis that the Panama Canal expansion hasn’t influenced the competitiveness between ULCV vessels.
References
Abt, N. (2008). Some East Coast Ports to Gain From Panama Canal Expansion. Transportation Topics.
ACP (2006). Proposal for the Expansion of the Panama Canal, Third Set of Locks.. Canal de Panama.
ACP (2013). Annual report 2013. Canal de Panama.
Acp.gob.pa. (2014). Marine Tariff. [online]
Available at: http://www.acp.gob.pa/eng/op/tariff/index.html
[Accessed 23 May 2017].
Brage (2014). The Expansion of the Panama Canal. | Norwegian School of Economics [online]
Available at: https://brage.bibsys.no/xmlui/bitstream/handle/11250/222775/Masterthesis90.pdf?sequence=1
[Accessed on 24 May 2017]
Bunkerworld.com (2016). Bunkerworld Prices. [online]
Available at: http://www.bunkerworld.com/prices
[Accessed 23 May 2017].
Carey, N. (2006). East Coast ports in U.S. preparing for more Asian imports. The New York Times.
Containerst.com. (2016). Rush of ULCV orders ends. [online]
Available at: http://www.containerst.com/news/view,rush-of-ulcv-orders-ends_43098.htm
[Accessed 23 May 2017].
Drewry (2013). Ship Operating Costs Annual Review and Forecast 20013/14. London: Drewry Shipping Consultants Ltd, p.Chapter 6.
Dublish, C. (2005). East Coast’s Mega Expansion. Traffic World.
Dupin, C. (2006). The post-Panamax Canal. American Shipper, (48), p.12.
Dupin, C. (2009). Port’s ship come in. American Shipper, (51), p.5.
European Commision (2009). Terminal handling charges during and after the liner conference era. Competition reports. Brussels, p.49.
Forbes (2013). Logistics Impacts from Widening the Panama Canal. [online]
Available at: http://www.forbes.com/sites/stevebanker/2013/09/06/logistics-impacts-from-widening-the-panama-canal/
[Accessed 24May 2017]
Guexed.com. (2017). The world’s biggest container ship | School of Executive Education. [online]
Available at: https://www.guexed.com/the-worlds-biggest-container-ship
[Accessed 23 May 2017].
Harries, S., Dolerud, E. and Sames, P. (2013). Port Efficiency Simulations for the Design of Container Ships. 1st ed. p.15.
Joc.com. (2017). Panama Canal Expansion. [online]
Available at: http://www.joc.com/special-topics/panama-canal-expansion
[Accessed 10 May 2017].
Joseph Bonney, S. (2016). New Panamax ships total 11 percent of canal transits. [online] Joc.com.
Available at: http://www.joc.com/port-news/panama-canal-news/new-panamax-ships-total-11-percent-canal-transits_20161114.html
[Accessed 23 May 2017].
Knight, K. (2008). The Implications of Panama Canal Expansion to U.S. Ports and Coastal Navigation Economic Analysis. Institute for Water Resources, US Army Corps of Engineers, p.27.
LAtimes. (2017). Panama Canal expansion bogs down in disputes, cost overruns. [online]
Available at: http://articles.latimes.com/2014/feb/06/world/la-fg-wn-panama-canal-expansion-disputes-cost-overruns-20140206
[Accessed 10 May 2017].
Logistics, P. (2017). Top 3 Reasons to Use Intermodal Transportation. [online] Info.plslogistics.com.
Available at: http://info.plslogistics.com/blog/top-3-reasons-to-use-intermodal-transportation
[Accessed 23 May 2017].
Maersk. (2017). [online]
Available at: http://www.maersk.com/en
[Accessed 23 May 2017].
Maritime-connector.com. (2017). Panamax and New Panamax | Maritime-Connector.com. [online]
Available at: http://maritime-connector.com/wiki/panamax/
[Accessed 10 May 2017].
McCray, J. and Gonzalez, J. (2007). Cirtical Infrastructure at U.S. West Coast Intermodal Terminals: Are Canadian or Mexican Terminals an Alternative?. Washington D.C: Transportation Research Board, Paper no. 08-1323.
Micanaldepanama.com. (2017). Frequently Asked Questions | Expanded Panama Canal. [online]
Available at: http://micanaldepanama.com/expansion/faq/
[Accessed 10 May 2017].
Mitchell, C. (2011). IMPACT OF THE EXPANSION OF THE PANAMA CANAL: AN ENGINEERING ANALYSIS. [online]
Available at: https://www.ce.udel.edu/UTC/Mitchell%20-%20Impact%20of%20the%20Expansion%20of%20the%20Panama%20Canal%20FINAL%20with%20Chapters.pdf
[Accessed 23 May 2017].
Miller, G. (2008). US Container Trades. Fairplay International Shipping Weekly, (364).
Notteboom, P. and Carriou, T. (2009). Fuel surcharge practices of container shipping lines: Is it about cost recovery or revenue making?. Copenhagen, Denmark: International Association of Maritime Economists (IAME).
Notteboom, T. and Rodrigue, J. (2011). Challenges to and challengers of the Suez Canal. Port Technology International, (51).
Pancanal.com. (2006). Proposal for the Expansion of the Panama Canal – Third Set of Locks. [online]
Available at: http://www.pancanal.com/eng/acp/index.html
[Accessed 10 May 2017].
Pancanal.com. (2013). Annual Report 2013. [online]
Available at: http://www.pancanal.com/eng/acp/index.html
[Accessed 10 May 2017].
Pancanal.com. (2014). ACP. [online]
Available at: http://www.pancanal.com/eng/acp/index.html
[Accessed 10 May 2017].
Porttechnology.org. (2017). Terminal Automation and Training | Port Technology International. [online]
Available at: https://www.porttechnology.org/conference
[Accessed 23 May 2017].
Pulse Headlines. (2017). Panama Canal expansion to be completed this month. [online]
Available at: http://www.pulseheadlines.com/panama-canal-expansion-completed-month/36698/
[Accessed 10 May 2017].
Rctom.hbs.org. (2017). The Panama Canal: The “Bottleneck” of Global Shipping? – Technology and Operations Management. [online]
Available at: https://rctom.hbs.org/submission/the-panama-canal-the-bottleneck-of-global-shipping
[Accessed 10 May 2017].
Rosales, M. (2007). THE PANAMA CANAL EXPANSION PROJECT: TRANSIT MARITIME MEGA PROJECT DEVELOPMENT, REACTIONS, AND ALTERNATIVES FROM AFFECTED PEOPLE. [online]
Available at: http://etd.fcla.edu/UF/UFE0021273/rosales_m.pdf
[Accessed 23 May 2017].
Ship & Bunker. (2016). Asia/Pacific Bunker Prices. [online]
Available at: http://shipandbunker.com/prices/apac
[Accessed 23 May 2017].
Shipspotting.com. (2017). MSC PALOMA – IMO 9441001 – Callsign 3FKQ – ShipSpotting.com – Ship Photos and Ship Tracker. [online]
Available at: http://www.shipspotting.com/gallery/photo.php?lid=1186363
[Accessed 23 May 2017].
Shipping Watch (2013). China rejects P3 alliance. [online]
Available at: http://shippingwatch.com/carriers/Container/article6809622.ece
[Accessed 24 May 2017]
Stopford, M. (2009). MARITIME ECONOMICS. 3rd ed. New York: Routledge.
Suez Canal Authority. (2014). Toll Calculator. [online]
Available at: http://www.suezcanal.gov.eg/calc.aspx
[Accessed 23 May 2017].
Terminal Velocity. (2013). The Journal of Commerce, (July 22, 2013).
The Huffington Post. (2017). Here’s Why The Panama Canal Expansion Has Everyone Excited. [online]
Available at: http://www.huffingtonpost.com/kathleen-peddicord/panama-canal-expansion_b_10773740.html
[Accessed 10 May 2017].
TMR Group. (2016). Container Fleet Market -Transparency Market Research. [online]
Available at: http://www.transparencymarketresearch.com/pressrelease/container-fleet-market.htm
[Accessed 23 May 2017].
Vesseltracking.net. (2017). Biggest container ships – industry overview – Vessel Tracking. [online]
Available at: http://www.vesseltracking.net/article/biggest-container-ship
[Accessed 10 May 2017].
Vesselsvalue.com. (2017). VesselsValue. [online]
Available at: https://www.vesselsvalue.com
[Accessed 23 May 2017].
Xe.com. (2017). XE: Convert HKD/USD. Hong Kong Dollar to United States Dollar. [online]
Available at: http://www.xe.com/currencyconverter/convert/?Amount=1&From=HKD&To=USD
[Accessed 10 May 2017].
Appendices
 Appendix 1
Appendix 1 is a screenshot of the excel equation. A full functional version has been copied onto the accompanying CD.
Cite This Work
To export a reference to this article please select a referencing stye below:
Related Services
View all


Related Content
All TagsContent relating to: "International Studies"
International Studies relates to the studying of economics, politics, culture, and other aspects of life on an international scale. International Studies allows you to develop an understanding of international relations and gives you an insight into global issues.
Related Articles

DMCA / Removal Request
If you are the original writer of this dissertation and no longer wish to have your work published on the UKDiss.com website then please: