Pandemic Disease Monitoring Tool Using Twitter Data
Info: 6799 words (27 pages) Dissertation
Published: 1st Mar 2022
Tagged: Computer ScienceSocial Media
Abstract
For, any statistical study, starting from predicting the winner of election, to governing the health statistics, huge amount of real time data is necessary. Twitter data is extensively used in recent times for such statistical studies. The speed at which news spread via twitter is phenomenal. When people tweet about the symptoms of a disease at a location, then these tweets help health care professionals to act appropriately and issue a warning about the probability of a disease becoming widespread. In this project, twitter data is collected for a few pandemic diseases, specifically Common cold, Influenza like Illness (ILI) with fever (ILIFever) and without fever (ILIECDC), Allergy, and Gastroenteritis to determine disease affected areas, locations which require monetary support for medication, and determining outbreak of diseases at a location precisely. A tool is developed to retrieve the tweets from Twitter using generic terms used in discussion for a disease selected. Retrieved tweets are processed and stored for further analysis. The credibility of stored tweets is determined by sentiment analysis. Other components were developed to: (1) effectively use medical vocabularies in retrieval of tweets, (2) visualize the disease related tweets to predict the widespread of diseases, (3) visualize the credible tweets statistics and compare it with total tweets for each disease, (4) visualize geo-tagged tweets to determine the location from which more tweets related to particular disease has been made, and (5) crowd sourcing disease related data from public and use an interactive maps to locate the disease affected areas. Integrating all the functionalities provides the user a choice to fetch the tweets, visualize the tweets, and visualize the crowdsourced data to predict the outbreak of a disease.
TABLE OF CONTENTS
Click to expand Table of Contents
1. INTRODUCTION
2. BACKGROUND
3. SYSTEM DESIGN
4. METHODOLOGY
4.1 Extracting tweets
4.1.1 Registering the app through twitter account
4.1.2 Method to retrieve 100 tweets per request
4.1.3 Medical to naïve term mapping
4.1.4 Query terms
4.2 Preprocessing and Storing tweets
4.2.1 Removal of metadata
4.2.2 Removal of stop words and converting it to tokens
4.2.3 Removal LF, CR, quotes and backslashes
4.2.4 Storing the tweets in MongoDB
4.3 Geo-tagging tweets
4.4 Credibility Assessment using Sentiment analysis
4.5 Crowd Sourcing
4.6 Visualization
5. ABOUT THE TOOL
6. RESULTS AND DISCUSSION
7. CONCLUSION
8. FUTURE WORK
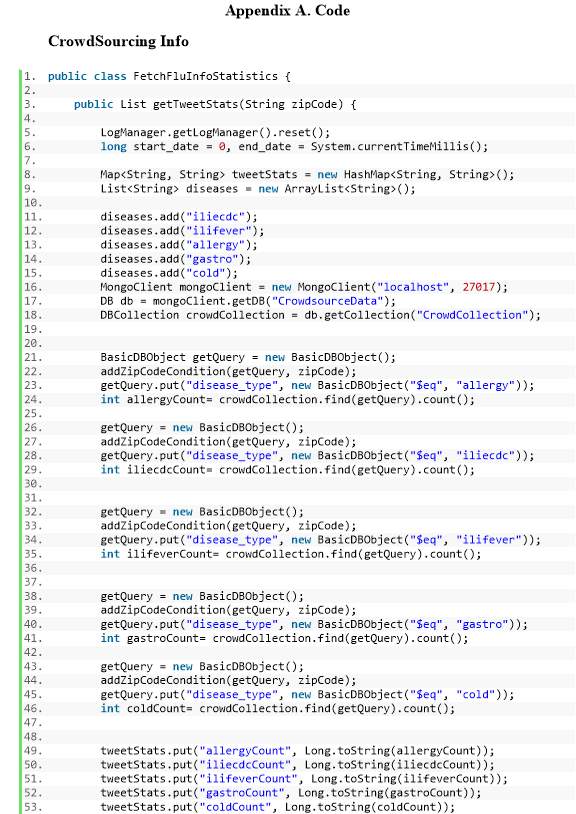
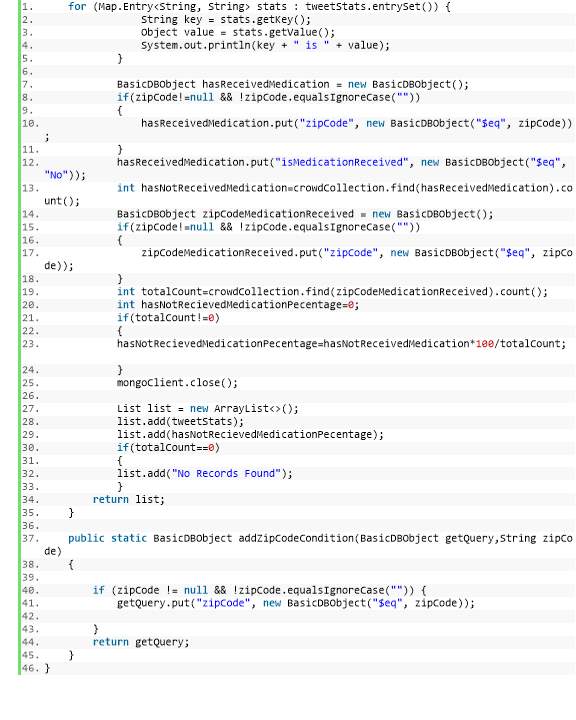
Appendix A. Code
References
Chapter 1. Introduction
Data is being generated in large amounts via social media like Twitter and Facebook. Twitter is one of the microblogging sites, allowing registered users to share and read opinions in short period. There are 335 million active twitter users worldwide and 6000 tweets are generated per second. The data thus generated if analyzed and visualized effectively, valuable insights can be acquired. Tweets cover wide range of areas like politics, technology, sports, movie reviews, natural disasters, product reviews, health. If the information is related to human health, then this data can be useful for health care professionals to determine the health issues faced by the public and act accordingly.
Conventional method used by the Centers for Disease Control and Prevention (CDC) includes collecting influenza-like illness (ILI) activity data from surveillant medical practices. Usually there is a 1-2-week delay between the time a patient is diagnosed and the moment that data point becomes available in aggregate ILI reports. But, tweets convey information at a faster pace and hence it can help health care professionals to make a quicker decision on what are the necessary steps to be taken to prevent the widespread of the disease. Users tweet related to various diseases such as heart diseases, Alzheimer’s, epidemic diseases etc. In this project, a study is carried out on five important pandemic diseases, namely, Influenza like Illness (ILI) with fever (ILIFever), ILI without fever (ILIECDC), Allergy, Gastroenteritis & Common cold by collecting the messages posted on Twitter with a mention of any of five disease indicators to track and predict the emergence and spread of those diseases in the population is considered [1].Medical vocabularies are also used to obtain the medical to naïve term mappings and the naïve terms for each of the disease is used in tweet retrieval from twitter.
Twitter data analysis is gaining importance in recent times among researchers due to its frequency, short messages and availability to public. Disease related tweets if analyzed efficiently, it will help health care professionals to identify the health-related trends in any area of geographical interest [2]. The data thus analyzed, if visualized and presented effectively, it can provide insights to public health professionals who are monitoring the disease outbreak to create awareness about the health risks at a geographical location as well as prevent the spread of diseases. In the tool developed, user will be provided with an option to choose any one of the five diseases, location and the time duration to visualize the tweets using world map and different types of chart. Visualizing the tweets arising from any geographical location at a duration of time helps in predicting and monitoring the health patterns precisely. Geo-tagged tweets are also visualized on the maps to identify the locations from which more tweets related to any of the five disease has been made. More no of red marks on the map indicate the increased activity of a disease in that location from a certain period.
Large amount of information related to diseases and many more topics are discussed in Twitter, but the credibility of information shared on Twitter as tweets, needs to be analyzed to prevent spreading of false information in inciting subjects like diseases. To analyze the credibility of tweets, the sentiment of the words in the tweets are considered. If the tweets include words like suffering, pain, severe, spread such tweets are “more likely” credible and tweets which include words such as probably, might be, could be are considered to be “less likely” credible. The sentiment polarity for credibility is defined using the words in the tweets. The credible tweets thus obtained by sentiment analysis is visualized and compared with the original no of tweets for each of the disease.
Crowdsourcing on the other hand is a way of obtaining necessary information from the public about the disease outbreak. It is a model that enables public or the crowd to utilize their knowledge, skills to act as a source of information and expertise [3]. Crowdsourcing results can contribute towards emergency evaluation into: creation of software or systems that can contribute voluntary information like rescue, medication or other activities which require technical knowledge. This data rarely will have a false positive value because only those people that are situation aware can provide such relevant information. Although authenticity of such information maybe low as it is an informal method, but it can provide great aid in saving lives of thousands of people during a disease outbreak [4]. Tool gives an option to the user who is interested to provide disease related information which they are currently suffering from or on behalf of others. The users are requested to enter some information like when they started feeling ill, any medication taken or not, zip code of the location from where they are providing information. All the data which is collected via this approach is visualized on the maps and the user can monitor the disease activity at a location by searching the flu info using zip code and disease which is prevalent in that location is shown on the right side of the maps with the help of pie chart.
The tool will provide the user an option to use medical vocabularies to extend the queries to fetch the tweets, obtain the tweet statistics, visualize the tweet statistics and geo-tagged tweets to predict diseases outbreak. It also helps to determine the credible tweets and compare it with the original no of tweets. Apart from this, the tool acts as a crowd sourcing platform in collecting disease related data from public and use the interactive maps to locate the disease affected areas from the data collected. The tool will be useful to health care professionals, Non-Governmental Organizations (NGO), World Health Organization (WHO) and people who actively monitor and predict disease widespread at any time at any location of the world.
Chapter 2. Background
For various diseases like H1N1, cancer, heart and food borne diseases, real-time surveillance systems have been built using data from twitter, web surveys and data from google search. Twitter data is used widely for determining health trends in various location. Various techniques are employed in retrieving and analyzing the tweets to make informed decisions related to diseases. The methodologies used in related work and how is it different from the current project will be discussed in this section.
In [5] influenza like illness data is collected every week through web surveys during influenza season. Web-based monitoring infrastructure was used to identify emergencies in public health, help in understanding global health trends, and the forecast models to assess the effects on the public. In this project, twitter data is considered and collected real-time based on supply based infodemiology and the terms used in general discussions are used to fetch the tweets.
Social Network Enabled Flu Trends (SNEFT) framework, monitors the tweets posted on Twitter with a specification of flu like symptoms(keyword based search) to track and predict the rise and spread of an influenza in a population is mentioned in [1].In this project, tool will provide an option to the extract tweets using the generic terms used in discussions related to five of the pandemic diseases, and the emergence and outbreak of disease will be visualized using the visualization frameworks which can be efficiently used by health care professionals.
Supervised algorithm to learn technical to naïve term pairs, based on pattern generalization and complete linkage clustering for influenza is mentioned in [6]. In this project, the mapping between the medical term and naïve terms is carried out using Consumer Health Vocabulary for five diseases.
Tweak the tweet idea for utilizing the Twitter platform for crowdsourcing information provision during disasters and mass emergency events is mentioned in [7].In this project, the tool acts a crowdsourcing platform, where the people interested in creating situation awareness can provide information related to diseases they are currently affected by and also can provide the information on behalf of others who are currently affected by any of the five pandemic disease. The health care professionals who are monitoring the rise and spread of disease can visualize the crowd sourced data by just entering the zip code of the location. In a location, if any of the disease activity is seen, then the no of user reports of those diseases crowdsourced via the tool will displayed in the pie chart as well as in maps.
A method was proposed to assess the credibility of the tweets to detect the spread of false information on twitter after the Japan earthquake. In [8] using Latent Dirichlet Allocation generated topic models and a ratio of similar opinions to all opinions about a subject was carried out. To determine the positive or negative opinion about a tweet, semantic orientation dictionary was used to perform sentiment analysis. In this project, polarity values are calculated based on the words in tweets for detecting the tweets which more likely credible and tweets which are less likely credible.
A case study was carried out to determine the location from which the tweets are arising and document the different types of location information available based on the twitter users, which could be used for monitoring health information online is mentioned in [9]. The tweets which are geo-tagged are used to determine the location from which the tweets are posted, and data is visualized on google maps. The tweets which don’t have the location data, the location of the user from where the account has been created is considered to determine the tweet location in this project.
Chapter 3. System Design
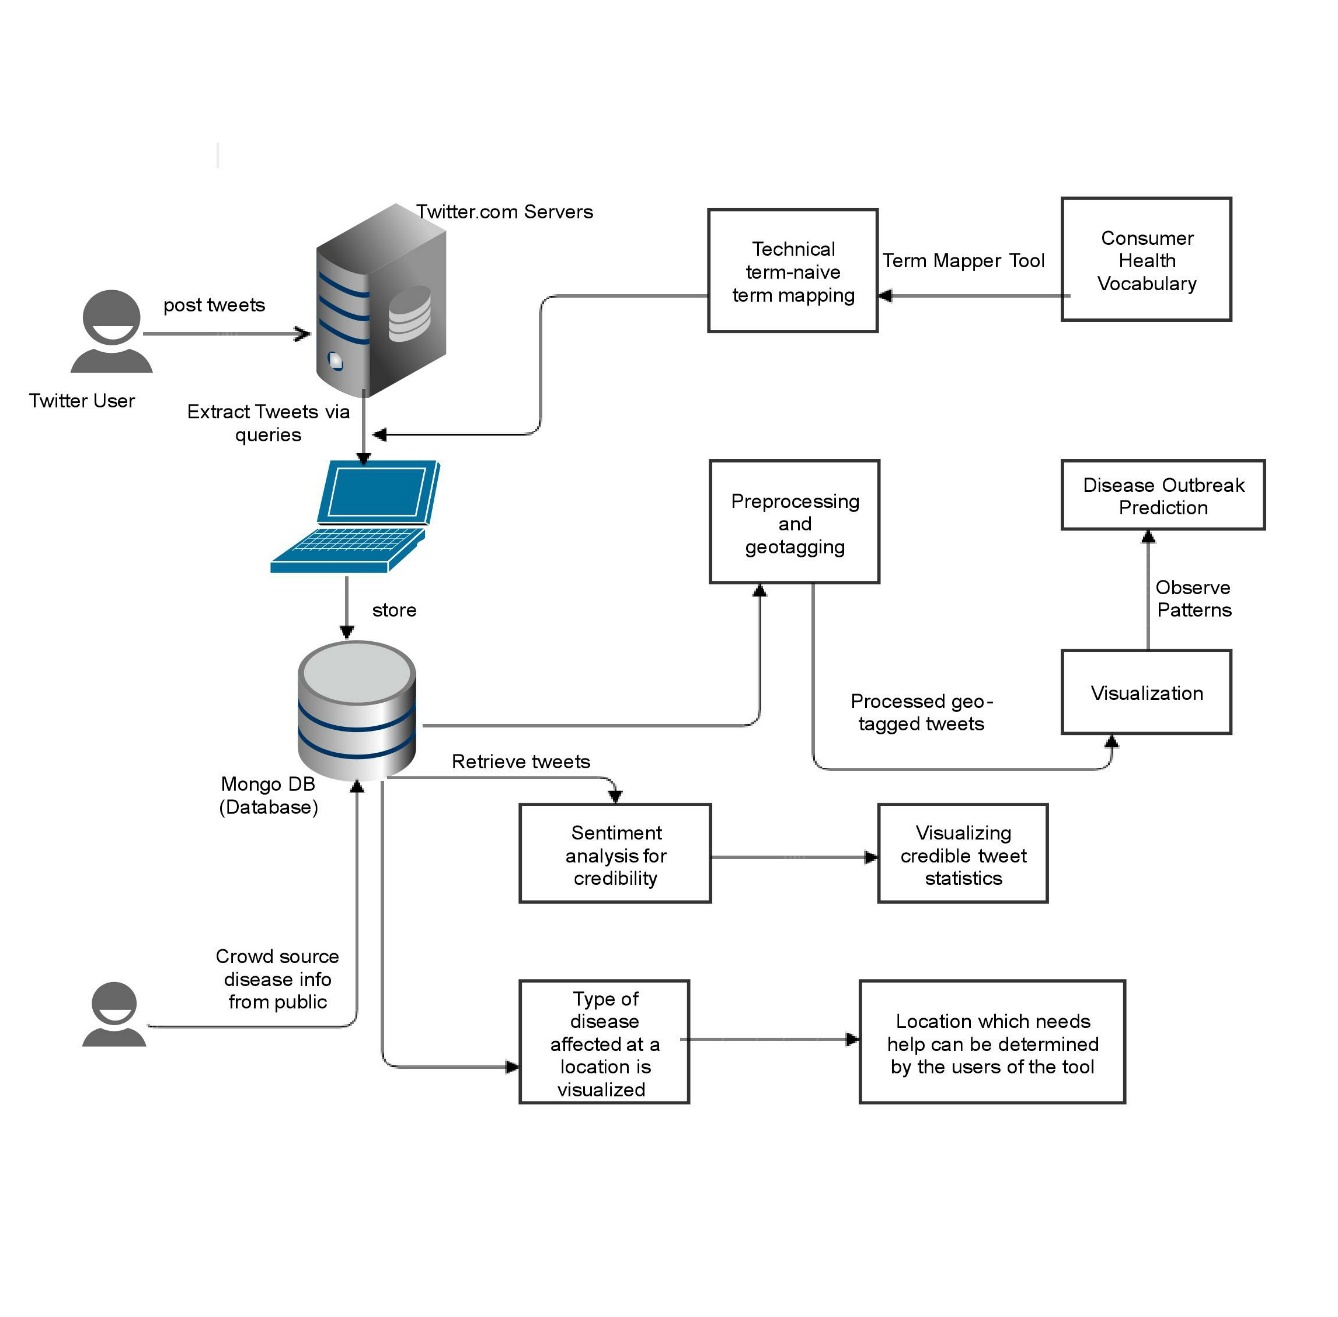
Figure 1. System Architecture
Chapter 4. Methodology
4.1 Extracting tweets

Figure 2. Extracting tweets
4.1.1 Registering the app through twitter account
To retrieve tweets from Twitter we need to access the streaming API of Twitter and obtain four values namely the API key, API secret, Access token and Access token secret. To get these values, an App needs to be registered through the twitter account. With the help of these values tweets can be retrieved. The tweets are fetched from the following URL: https://api.twitter.com/1.1/search/tweets.json?q=
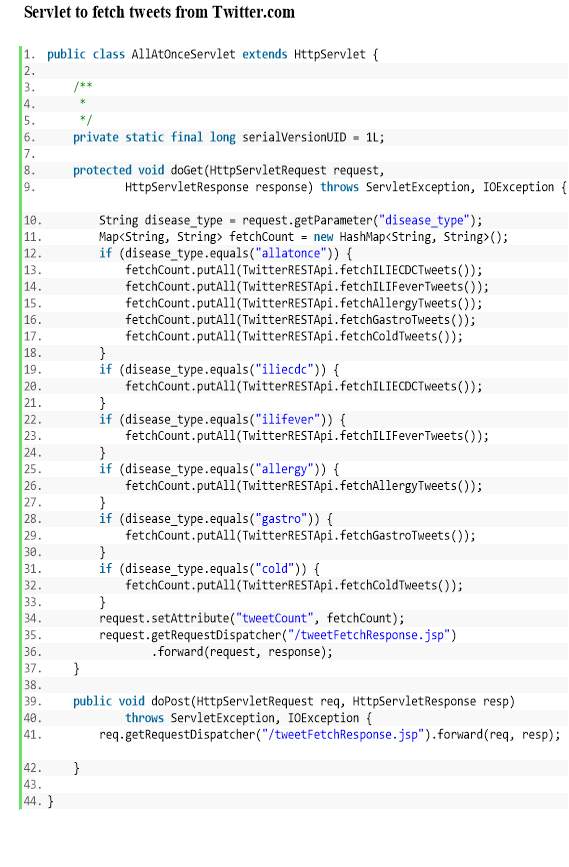
4.1.2 Method to retrieve 100 tweets per request
Tweets matching the query are fetched. Until there are no new tweets, the rest api is hit to retrieve all the tweets matching the query. In each request, maximum of 100 tweets are fetched. since only 100 tweets are returned per request, when there are multiple tweets more than 100 per request, then it must be traversed properly. For this reason, since_id and max_id is needed. max_id has the id of the last tweet in each request and since_id is the id till which the tweets have been extracted. After all the processing, the since_id and max_id properly must be set properly. max_id is reset to null, whereas since_id is set to the id of the first response in the request. Since in each request only 100 tweets are retrieved as a JSON response, to keep a record of all the tweets fetched so far and to return them to the user, append the new JSON response of each new request to older JSON response.
4.1.3 Medical to naïve term mapping
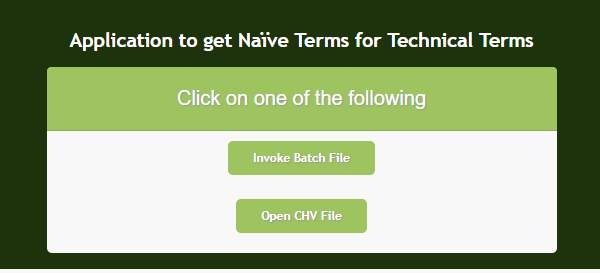
Figure 3. Invoking mapper to get naïve terms for medical terms
Demand based infodemiology and supply based infodemiology are the two ways to retrieve disease related tweets from Twitter. In demand-based approach, keywords present in the tweets are taken into consideration for retrieval of tweets. This approach is less efficient, since keywords are used in extraction of tweets and not all the cases are considered. In supply-based approach, the contents of the communication and communication patterns of web users are analyzed to retrieve the tweets. Layman terms for a medical technical term used in communication are considered for retrieval of tweets.
The generic terms used in the query to retrieve the tweets from Twitter for each of the five diseases are obtained from Consumer Health Vocabulary (CHV) [10]. CHV provides the mapping between medical terms to the terms used by a lay man. Most of the twitter users are not familiar with medical technical terms to tweet about a disease, they will use lay man terms while tweeting. For example, diarrhea and vomiting will be the terms used by a layman. If these symptoms are seen, then medically its categorized to be gastroenteritis. If twitter api is queried with the keyword gastroenteritis, then it will lead to extracting few or no tweets. Hence CHV is used. The CHV file is flat file which is invoked to obtain the naïve terms
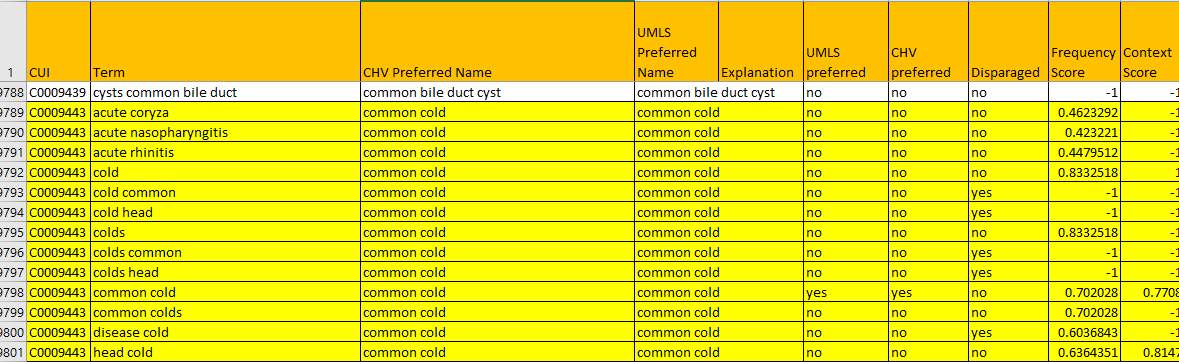
Figure 4. Flat file containing medical terms and corresponding naïve terms
4.1.4 Query terms
Terms used in Boolean queries to retrieve the tweets for each of the five pandemic diseases are listed below.
Query for ILI ECDC: queryterms.add(“(fever OR chills OR malaise OR unease OR weakness OR”body discomfort”OR”body ache”OR”body pain” OR headache OR”head ache”OR”head pain”OR myalgia OR”muscular pain”OR”muscle ache”OR”muscle pain”)AND(cough OR pharyngitis OR ”sore throat”OR”bad throat”OR”painful throat”OR”scratchy throat”OR”itchy throat”OR”raw throat”OR tonsillitis OR dyspnea OR”difficult breathing”OR”troubled breathing” OR breathlessness OR”chest pain”)”);
Query for ILI Fever: queryterms.add(“(fever OR feverishness OR chills)AND(malaise OR unease OR weakness OR”body discomfort”OR”body ache”OR”body pain” OR headache OR”head ache”OR”head pain”OR myalgia OR”muscular pain”OR”muscle ache”OR”muscle pain”)AND(cough OR pharyngitis OR ”sore throat”OR”bad throat”OR”painful throat”OR”scratchy throat”OR”itchy throat”OR”raw throat”OR tonsillitis OR dyspnea OR”difficult breathing”OR”troubled breathing” OR breathlessness OR”chest pain”)”);
Query for Allergy: queryterms.add(“(-fever AND -chills AND(-discomfort AND -weakness AND-”body ache”AND-”body pain”)AND -headache AND-”head ache”AND(-”muscular pain”AND-”muscle pain”)AND -cough AND(-”sore throat”AND-”bad throat”AND-”painful throat”AND-”scratchy throat”AND-”itchy throat”AND-”raw throat”AND -tonsillitis)AND(-”difficult breathing”AND -breathlessness AND-”chest pain”))AND(”runny nose”OR”blocked nose”OR sneezing OR ”watery eyes”OR”bloodshot eyes”)”);
Query for Gastroenteritis: queryterms.add(“(-fever AND -chills AND-”body ache”AND-”body pain”AND -headache AND-”head ache”AND-”muscular pain”AND-”muscle pain”AND -cough AND -throat AND -breathlessness AND-”chest pain”)AND(((diarrhea OR dysentery) AND nausea)OR((diarrhea OR dysentery)AND(emesis OR vomiting OR puke))OR((diarrhea OR dysentery)AND”abdominal pain”)OR(nausea AND(emesis OR vomiting OR puke))OR(nausea AND”abdominal pain”)OR((emesis OR vomiting OR puke) AND”abdominal pain”))”);
Query for Cold: queryterms.add(“(-fever AND -chills AND(-”body ache”AND-”body pain”)AND -headache AND-”head ache”AND(-”muscular pain”AND-”muscle pain”)AND -cough AND -”difficult breathing”AND -breathlessness AND-”chest pain”AND -eyes)AND(((”Runny nose”OR”blocked nose”)AND Sneezing)OR((”Runny nose”OR”blocked nose”)AND Cough)OR((”Runny nose”OR”blocked nose”)AND”Sore throat”)OR(Sneezing AND Cough)OR(Sneezing AND”Sore throat”)OR(Cough AND”Sore throat”))”);
4.2 Preprocessing and storing tweets
Tweets include metadata, like, hashtags, usernames, URL’s, stop words, quotes and backslashes which must be preprocessed before storing it.
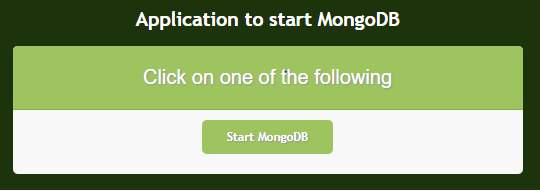
Figure 5. Starting the MongoDB database
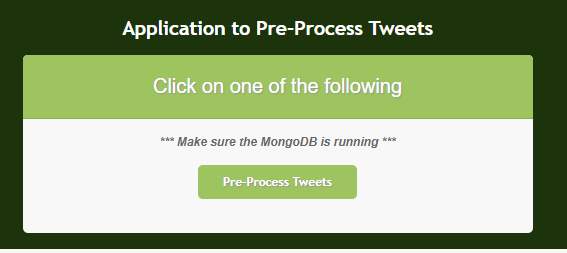
Figure 6. Preprocessing tweets
4.2.1 Removal of metadata
Hashtags, usernames and URL’s are replaced with an empty string using pattern matching technique.
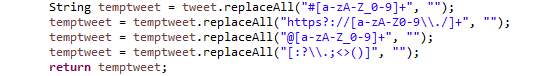
Figure 7. Code snippet for metadata removal from tweets
4.2.2 Removal of stop words and converting it to tokens
Commonly used words in any language are called stop words. For example: I am developing web applications, I and am are stop words. The file containing list of stop words is read and stored in a hash set. The hash set holds a list of stop words to be removed when generating word clouds etc. After the removal of stop words, tweets are converted into individual tokens. Splitting is formed on space.
4.2.3 Removal LF, CR, quotes and backslashes
Line Feed (LF), Carriage Return (CR), quotes and backslashes are replaced with an empty string using pattern matching technique.
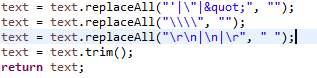
Figure 8. Code snippet to remove LR, CR, quotes and backslashes
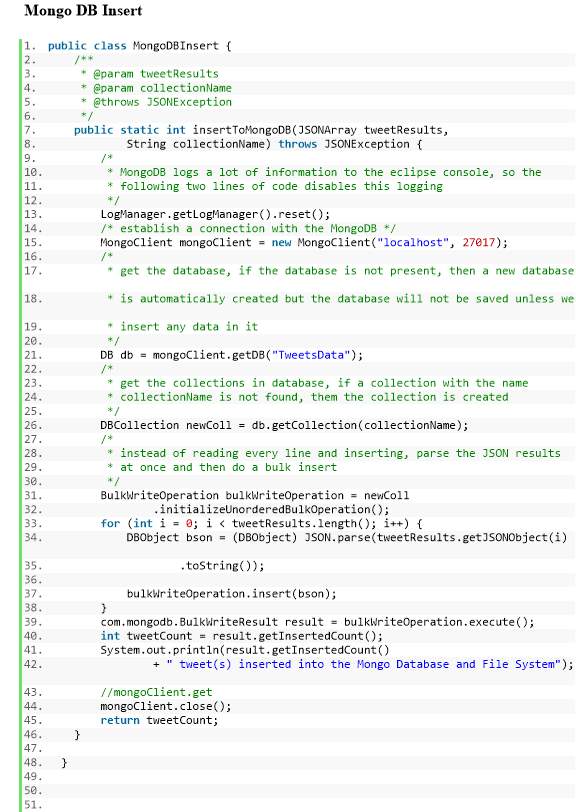
4.2.4 Storing the tweets in MongoDB
The retrieved tweets are in JavaScript Object Notation (JSON) format. A NoSQL database is needed to store the retrieved tweets. MongoDB is used for this purpose. Collection and documents are the main concepts around which MongoDB works. A group of MongoDB documents is collection and key-value pair set are documents.
Established a connection with MongoDB using mongo client and get the database from the MongoDB server, if it’s not present then a new database is automatically created but the database will not be saved unless any data is inserted in it. “TweetsData” database is created. JSON results are parsed at once and a bulk insert of tweets related to each disease as a collection with name of disease as collection name is carried out. Instead of reading and inserting line by line, bulk insert is done as it is more efficient. The JSON results are stored in BSON (binary encoding of JSON-like documents) format internally in MongoDB as it provides datatypes binary and Date which are not provided in JSON.
Dates in tweets is in Coordinated Universal Time (UTC) format and in MongoDB tweets are searched based on International Organization for Standardization (ISO) date format, hence there is incompatibility. To make efficient comparison, the date in Tweets which is in UTC format is converted to timestamp. Timestamp is a long data type provided by BSON. Comparison on timestamp is straightforward in MongoDB as it is like comparing long integer values. For efficient retrieval tweets, indexing is done based on timestamp field.
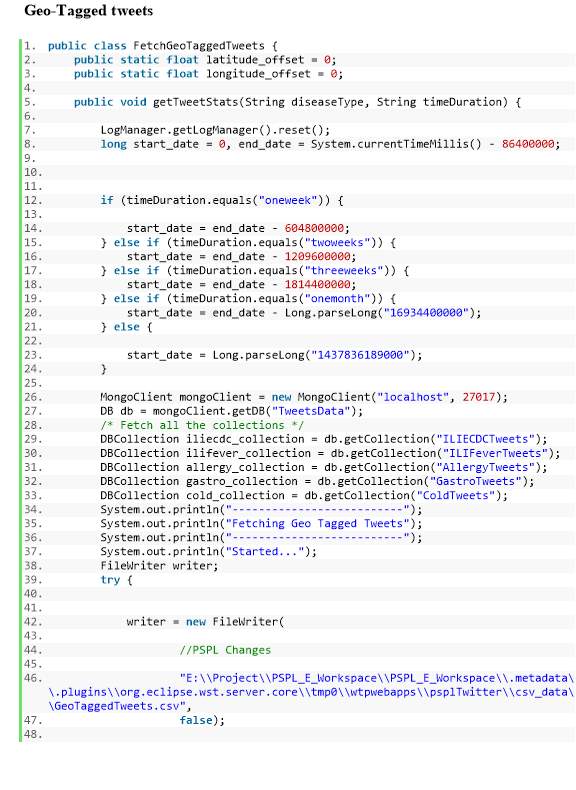
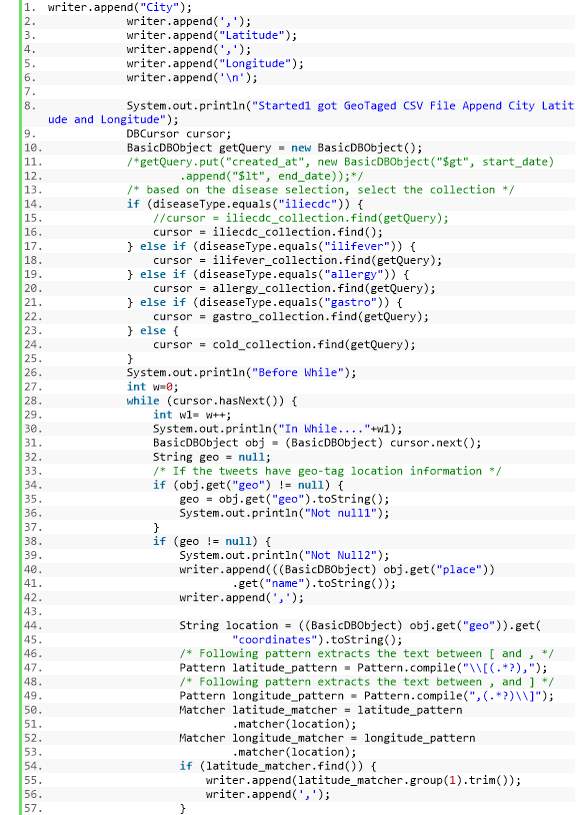
4.3 Geo-tagging tweets
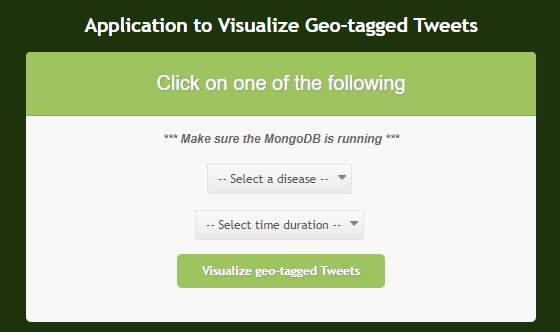
Figure 9. Visualizing Geo-tagged location tweets
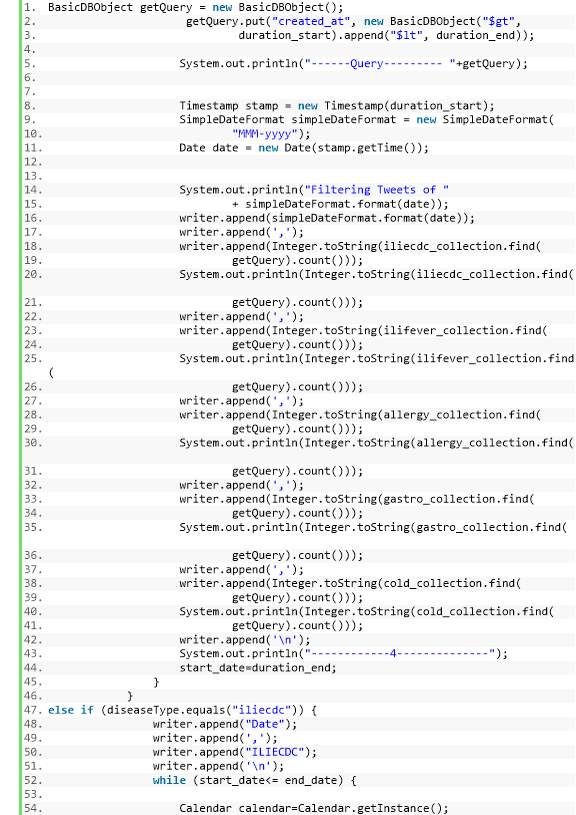
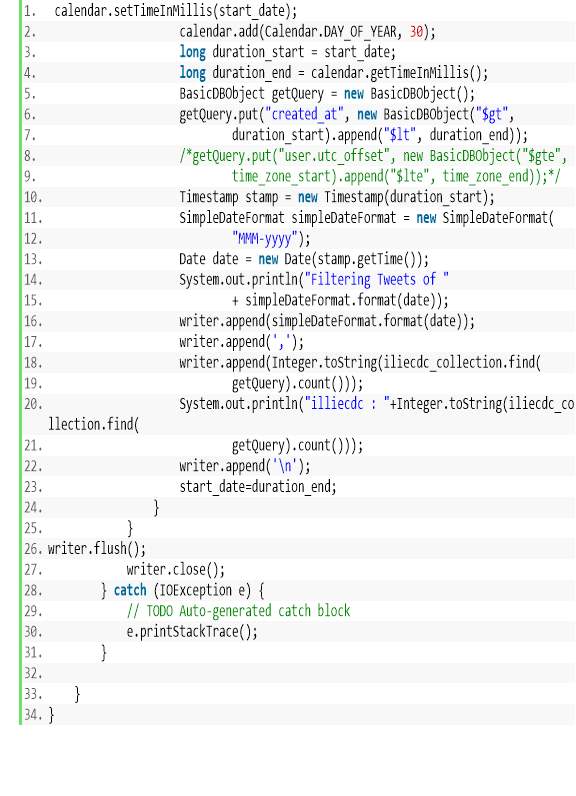
Geotagged tweets are the ones associated with location details from where the tweet has been made. This information can be plotted on the map to determine the location from which tweets are posted. If no of tweets arising from a location is more, then that area is likely to be affected by the disease [11]. The geo-field in the JSON response provides latitude and longitude values, with the help of these values the location is marked on the maps. If geo-field in the response JSON is null, then the utc_offset values are fetched and mapped to time zones. With the help of time zone, corresponding latitude and longitude values are obtained and the location is marked on the map [12] [13]. D3.js is used for effective visualization. The world and the city details are loaded and displayed, then latitude and longitude values are mapped to location and displayed on the world map using d3.js visualization JavaScript library. Geo-tagged tweets are visualized for a week, three weeks, month and beginning of the time by converting the day, week and month duration to milliseconds.
4.4 Credibility Assessment using Sentiment analysis
4.5 Crowd Sourcing
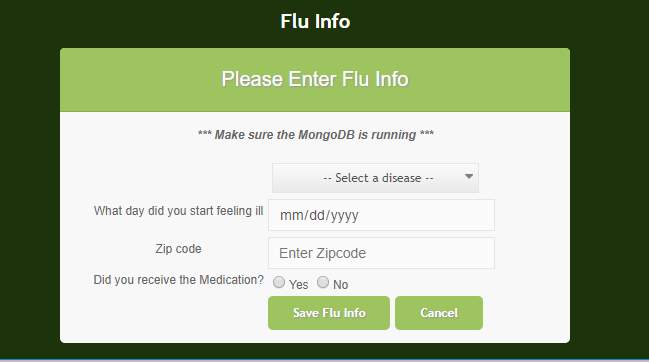
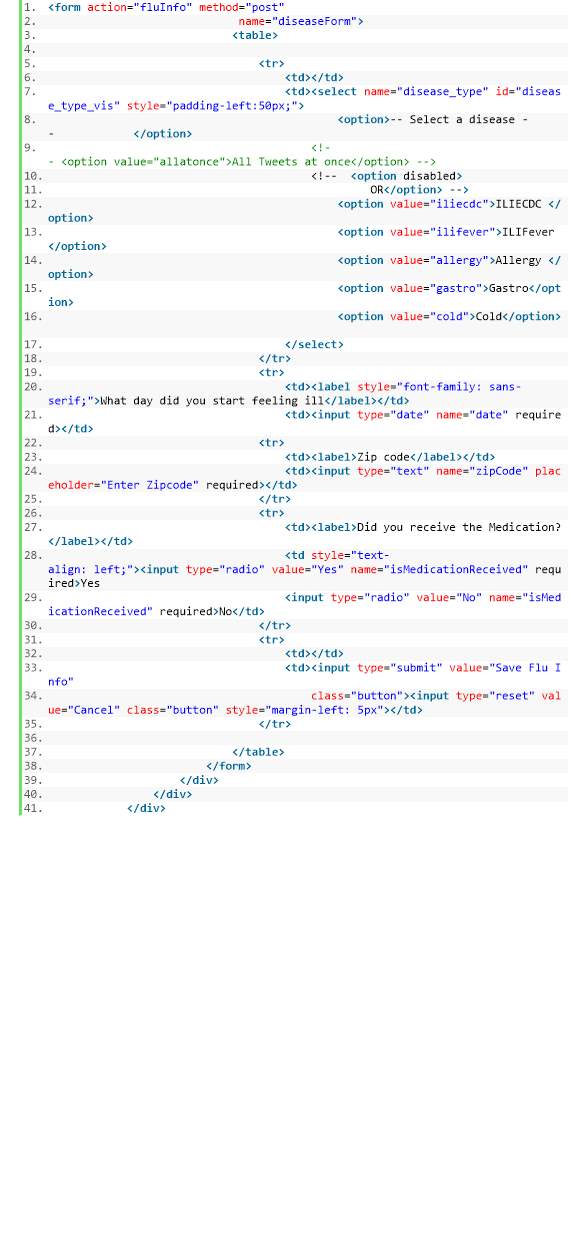
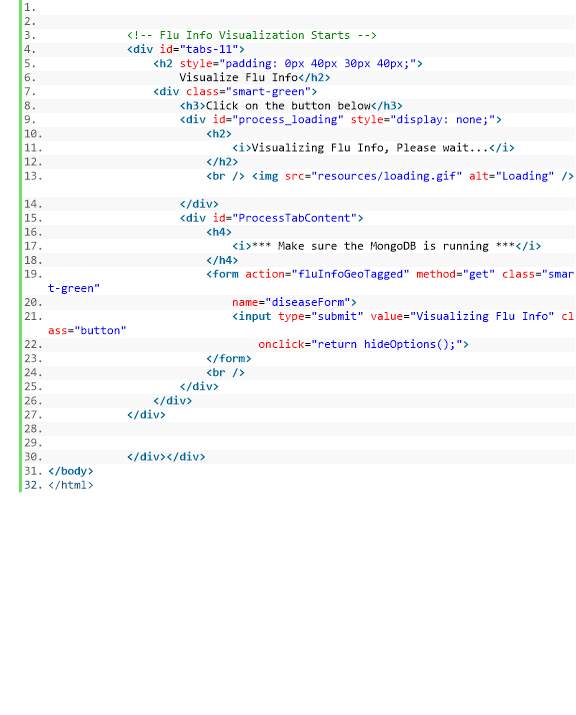
Figure 11. Form to crowd source data from public
The tool acts as a crowdsourcing platform where the public, health care professionals or anyone who is interested to create situation awareness can provide information related to a disease, who are currently affected by the disease or on behalf of others who are affected. The user is provided with a form to fill details like the name of disease, the date from when they started feeling ill and whether they took any medication or not. The data thus collected is stored in mongo dB server in “Crowdsourced data” database. Bulk write operation is done and data is stored as BSON internally.
The crowdsourced data can be visualized using the google maps and pie charts to determine quickly the increased activity of a disease at a location. The user can enter the zip code of the location to monitor which disease is prevailing in that area, once the user enters the zip code the any of five disease which is prevailing in that area will be displayed using pie chart and no of users who reported the disease activity can be seen. For this purpose, Google’s visualization API and pie chart package are loaded, and a call back method is set to run when the Google visualization API is loaded. Callback creates and populates a data table, instantiates the pie chart, passes in the data and draws it.
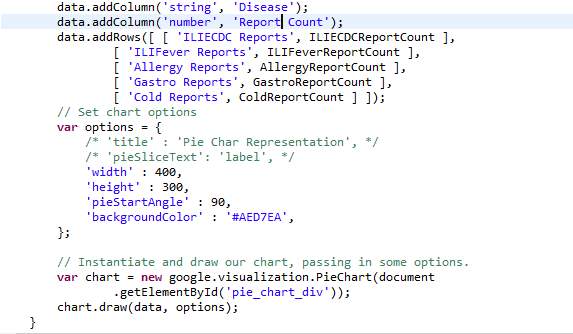
Figure 12. Code snippet to draw pie chart using Google visualization API
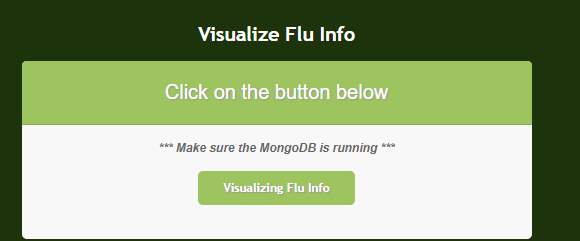
Figure 13. Visualizing crowd sourced data
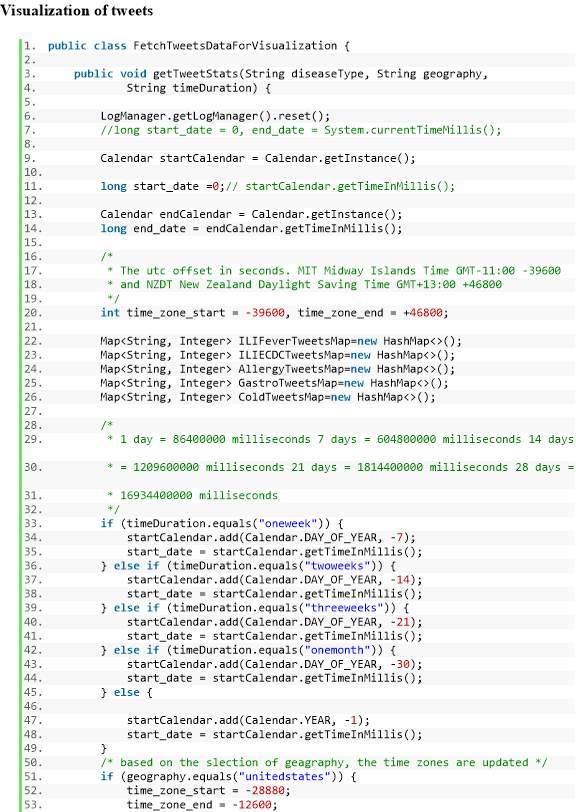
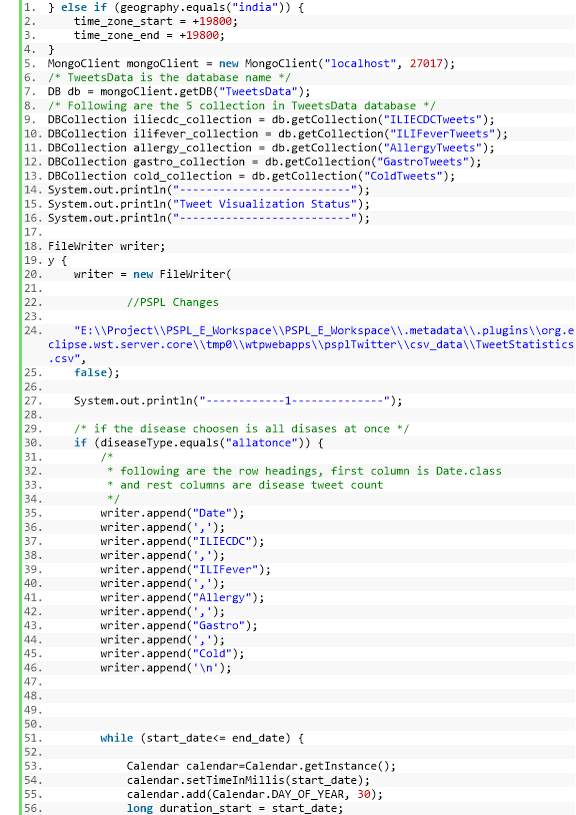
4.6 Visualization
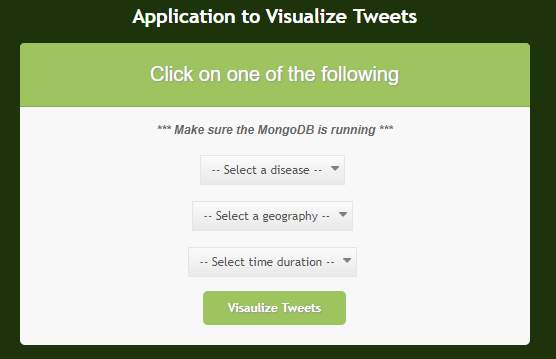
Figure 14. Visualizing tweets based on disease selected, location and duration
Effective visualization of analytics results helps to make wise decision in critical situations, helps in comprehending the complex concepts quickly and trends can also be deduced. Exhibiting the importance of data via visualization is an effort to recognize the correlations, patterns present in data easily. Visualizing enormous amount of complex data pictorially or graphically is preferred rather than textual content in recent times, as it helps in grasping the information at a faster rate. D3.js is very useful in visualizing the statistical data through different types of charts like bar, line, stream and area.
Visualization of disease related tweets helps to predict the emergence and spread of diseases precisely. Tweet statistics are visualized by loading google API’s and pie chart package. Callback methods are used to creates and populates a data table, instantiates bar chart or pie chart, passes in data and draws it. Geo-tagged and visualization of tweets for each of diseases are visualized using bar, line and area charts and world maps provided by d3.js. This is achieved by loading d3.js library to the script source.
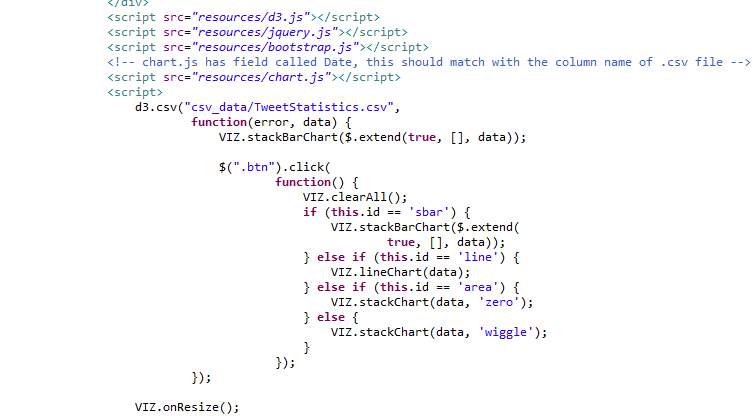
Figure 15. Code snippet to draw stream, bar, area and line chart using d3.js
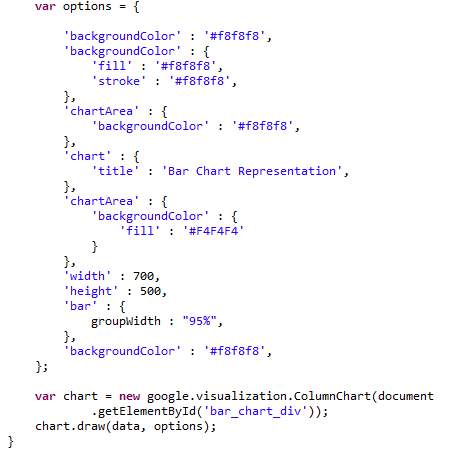
Figure 16. Code snippet to draw bar chart using Google visualization API
Chapter 5. About the Tool
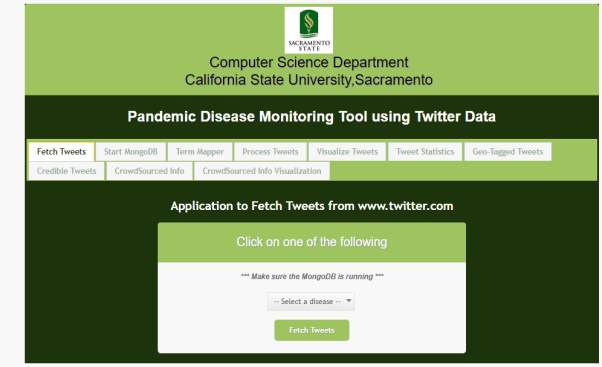
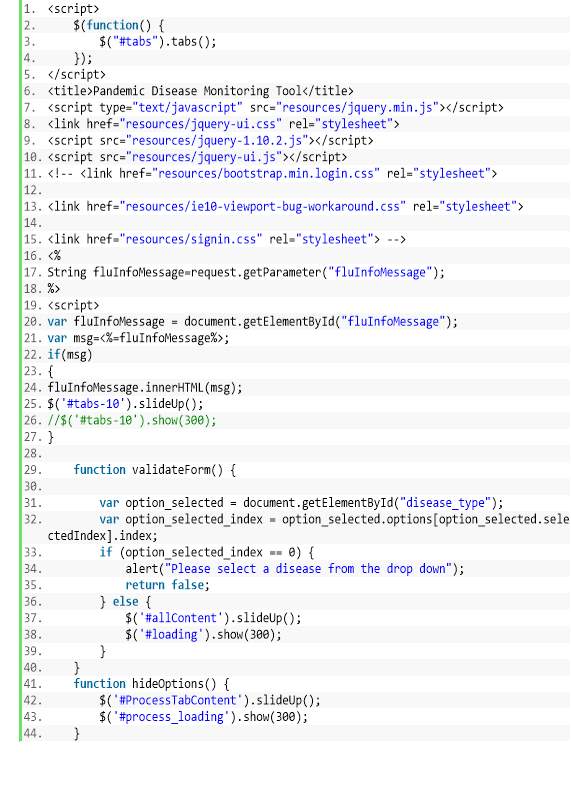
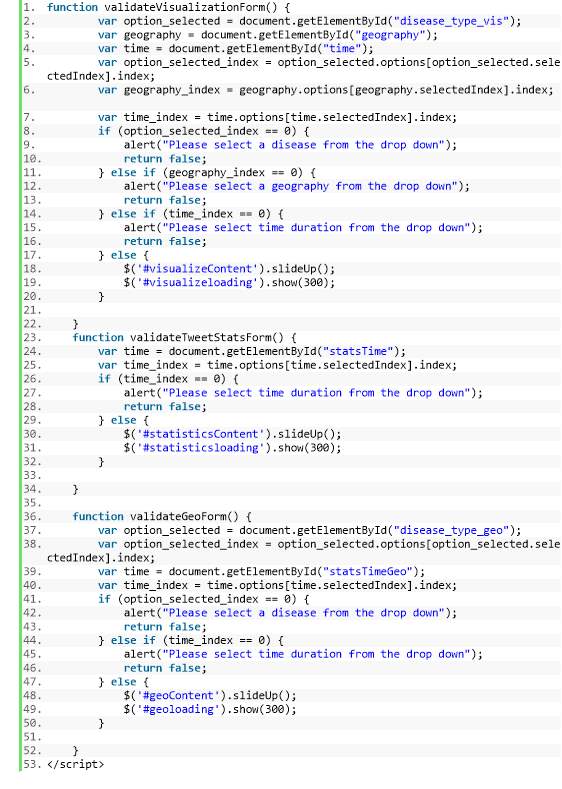
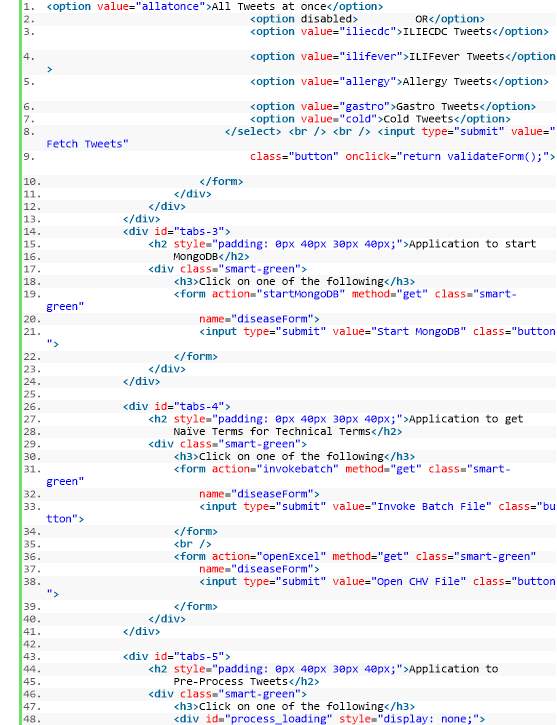
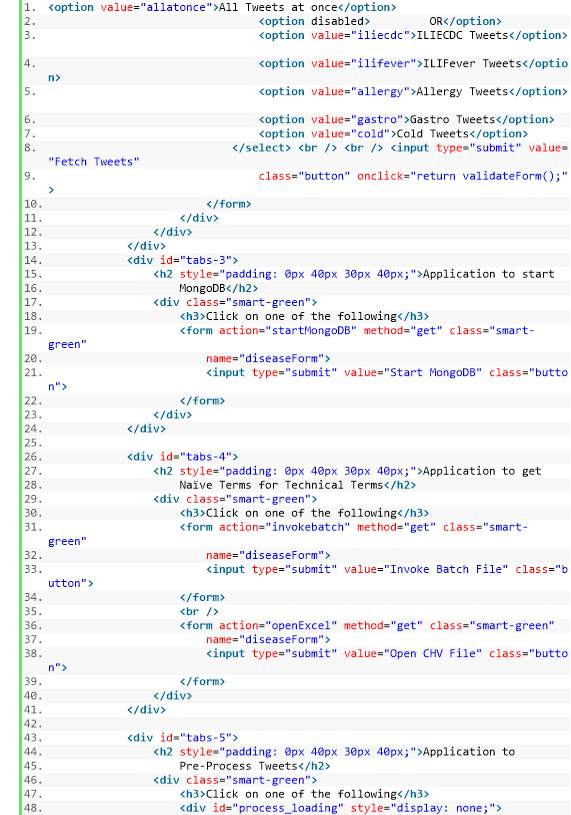
Figure 17. Tool containing all the components
- User must start the MongoDB before fetching the tweets and it should be running continuously.
- Mapper must be invoked to obtain the naïve terms to fetch the tweets.
- User can fetch the tweets related to any one disease or all five disease related tweets at once.
- Process the tweets for the faster retrieval for further analysis.
- The user can select the time duration to be a week, two weeks, three weeks, month, beginning of the time from when the tweets were collected for the first time for visualizing. Once selected the tool will process the information and display the results in bar, line, area and stream charts leveraging d3.js
- Once the user selects the time duration, the tool again processes the information and tweet statistics are visualized using pie chart of google API.
- When the user selects location to be World Wide or United States the disease activity in that area is displayed with a red dot on google maps using d3.js
- User who is interested to know about the credibility of tweets can visualize it and determine the no of credible tweets to total tweets for each of the disease.
- The tool acts a crowdsourcing platform, people interested in creating situation awareness can provide information related to disease emergence and that data is stored.
- The health care professionals who are monitoring disease emergence can enter the zip code of the location and the tool processes the information and a pie chart is displayed, indicating the no of reports pertaining to a disease in that location.
Chapter 6. Results and Discussion
Tweet Collection Results
The no of tweets collected for each of disease on October 16,2018 is shown in fig.18.
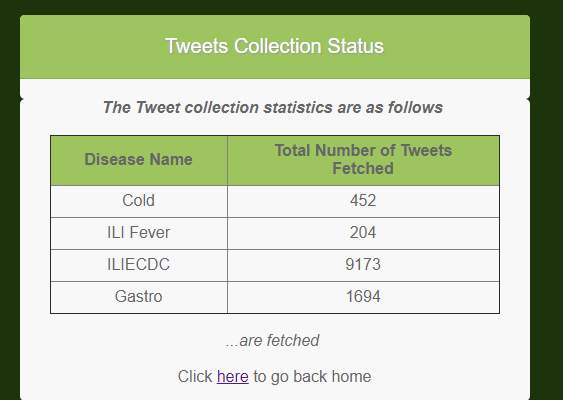
Figure 18. Tweets statistics collected on October 16, 2018
Pie and bar chart visualization of collected tweet statistics indicating no of tweets is shown in fig 19.
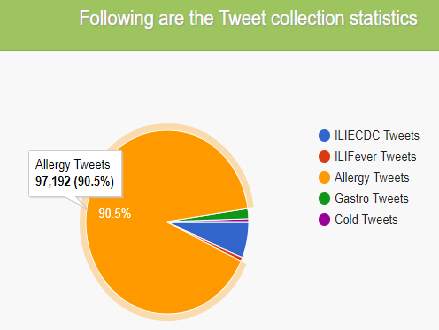
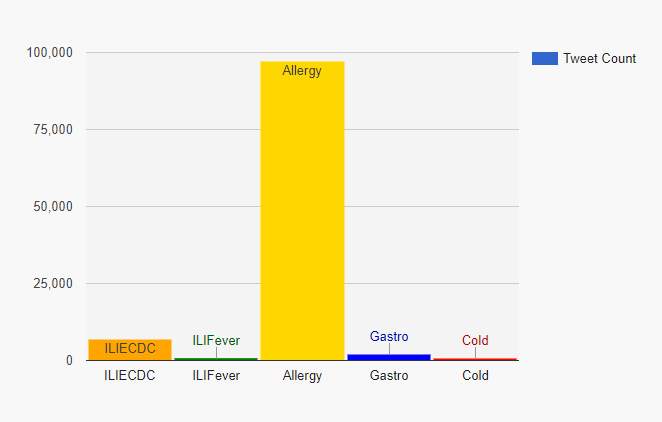
Figure 19. Tweet statistics visualization from beginning of time (Aug 2nd, 2018) using pie and bar chart
Visualization of tweet results
Bar chart is plotted with no of tweets against time duration for three weeks of time. If hovered over each of portion of bar chart, it indicates the no of tweets collected.
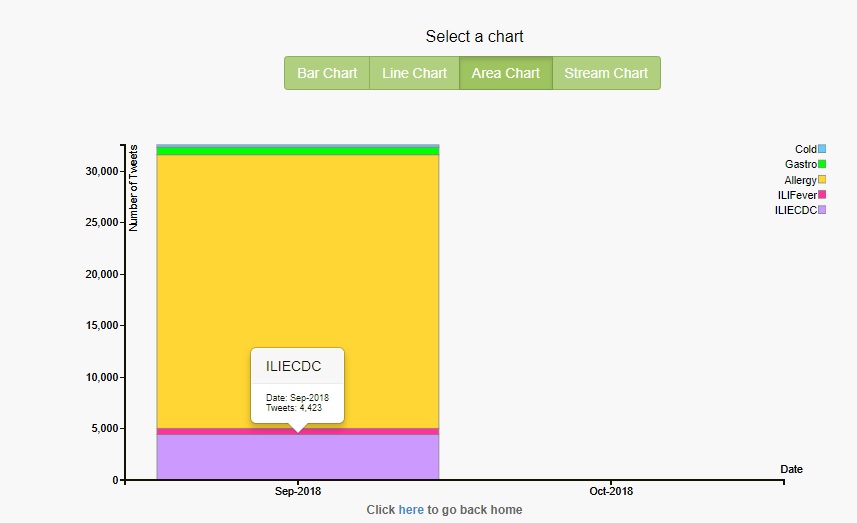
Figure 20. Three weeks, five diseases, bar chart
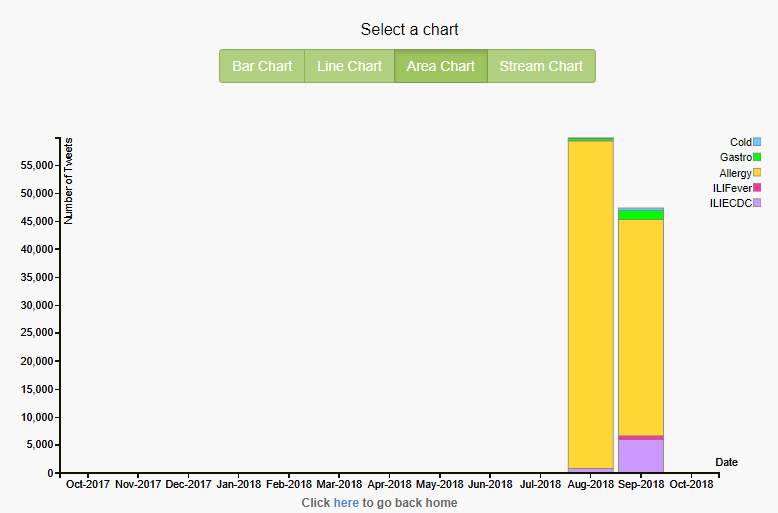
Figure 21. Beginning of time, five diseases, bar chart
Line charts depict the health trend or pattern over a period of time,instead of analyzing the individual data points.If hovered over the end point of line,it indicates the total no of tweets collected by the end of September.No of Allergy tweets collected over a period of time is increasing gradually as shown in fig 22.
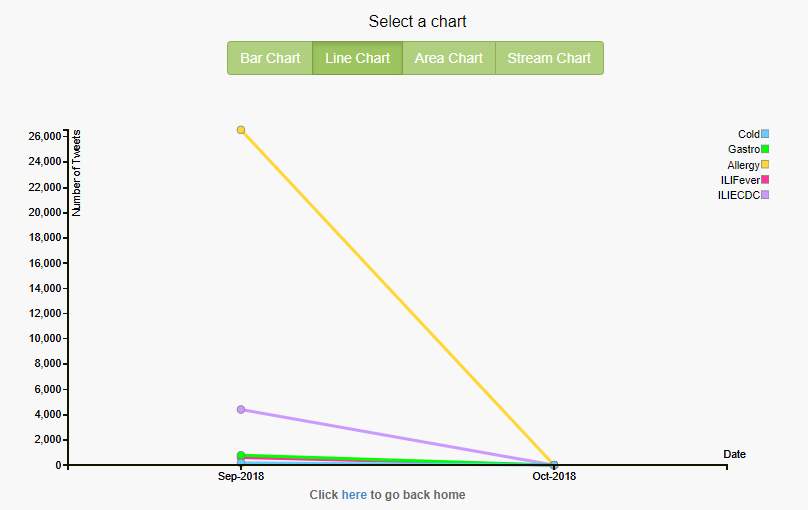
Figure 22. Last one month, five diseases, line chart
Area chart is used to portray the magnitude of health trends over a time instead of single data values. The magnitude is indicated in the area between the lines. The magnitude of allergy tweets is high for the month of September when compared to all other diseases and it shown in yellow color in fig 23.
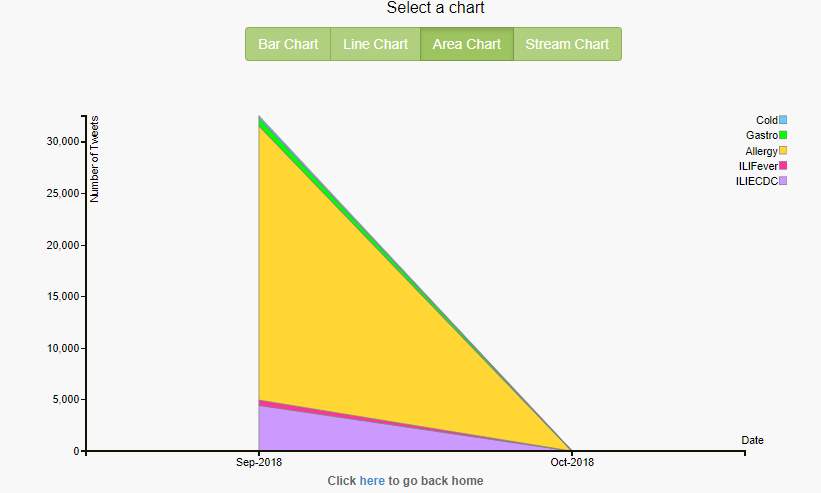
Figure 23. Last one month, five diseases, area chart
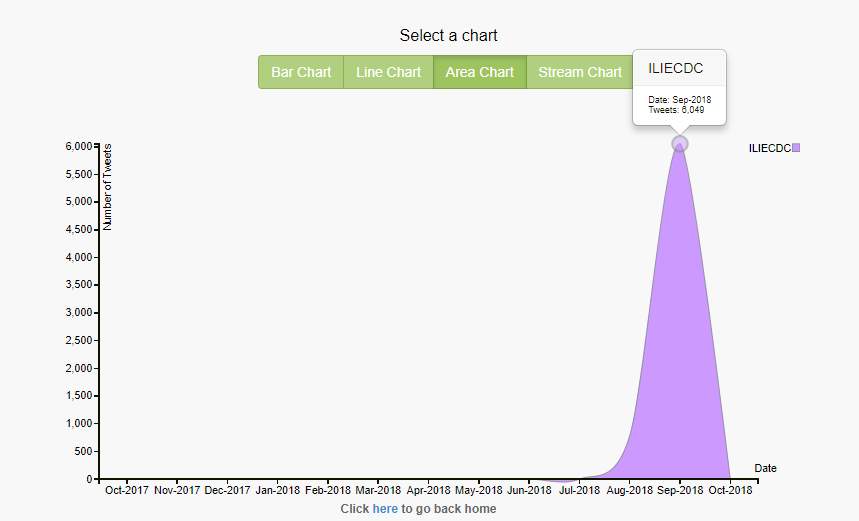
Figure 24. Beginning of time, ILIECDC, Area chart
Over a period, the changes in the no of tweets fetched for each of the diseases is shown with the help of stream charts. The peaks in the stream charts indicate that how over a period the no of tweets fetched changed. The duration is indicated by the length of the stream. Health trends and patterns are determined by observing the streams overall shape [14]. No of gastroenteritis tweets collected during the mid of September and decreased gradually during the end of September as shown in fig 25 in green color.
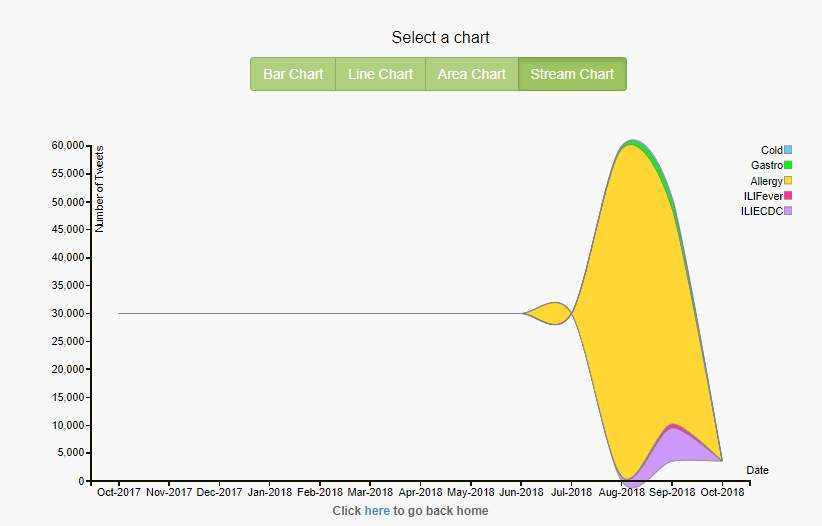
Figure 25. Beginning of time, five diseases, stream chart
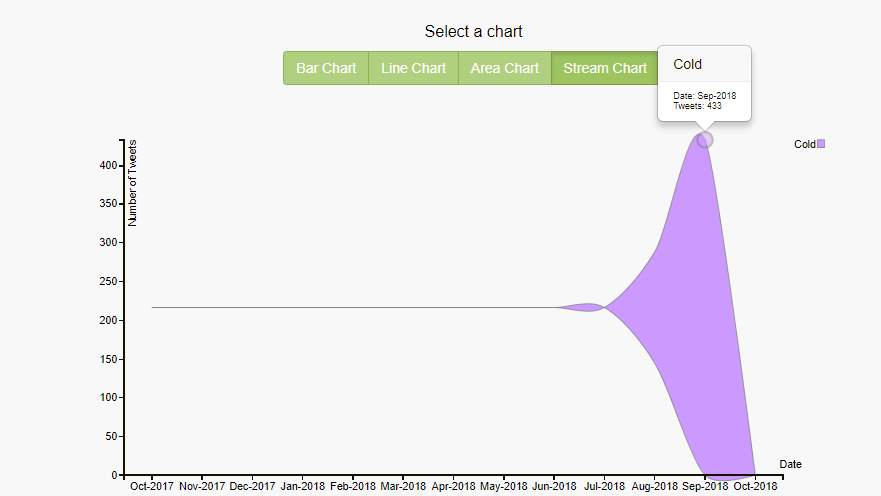
Figure 26. Beginning of time, cold, stream chart
Geo-tagged tweets are indicated by red marks on map and if hovered over the red mark it displays the location on map. Cold tweets are shown on map in fig 27 and waterloo is location from where the tweet has been posted.
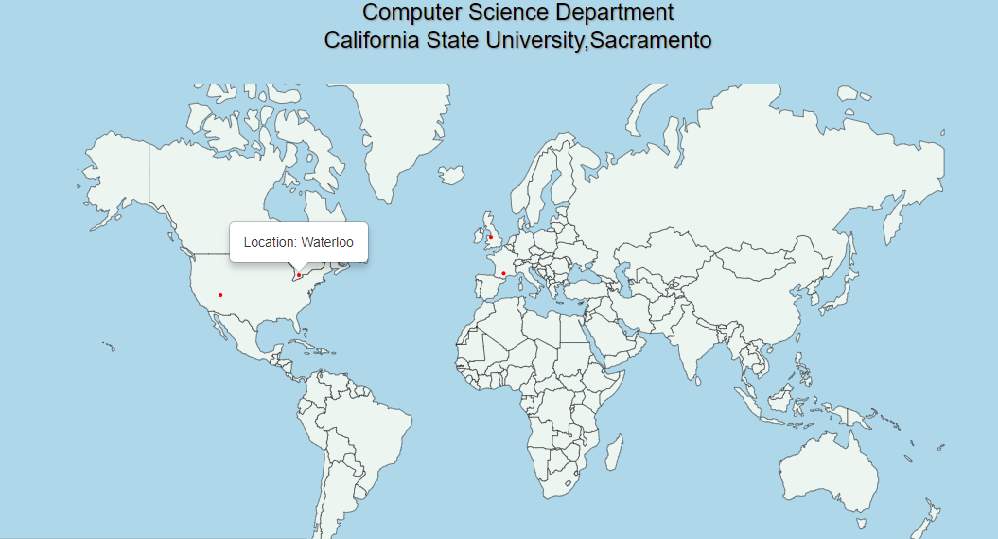
Figure 27. One-week Geo-tagged cold tweets
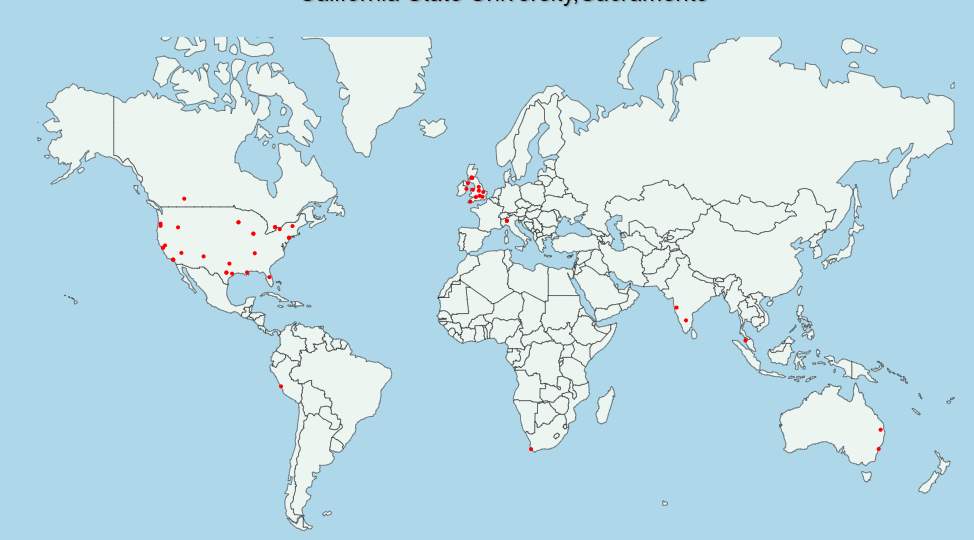
Figure 28. Two weeks Geo-tagged gastroenteritis tweets
Gradual increase in number of allergy related geo-tagged tweets from two weeks to one month is shown in fig 29 and 30.
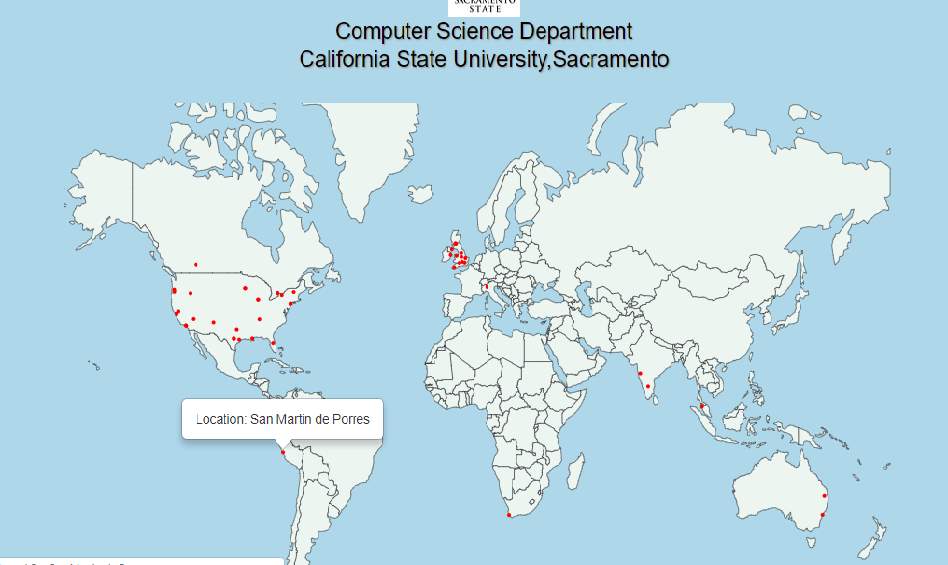
Figure 29. Two-weeks Geo-tagged allergy tweets
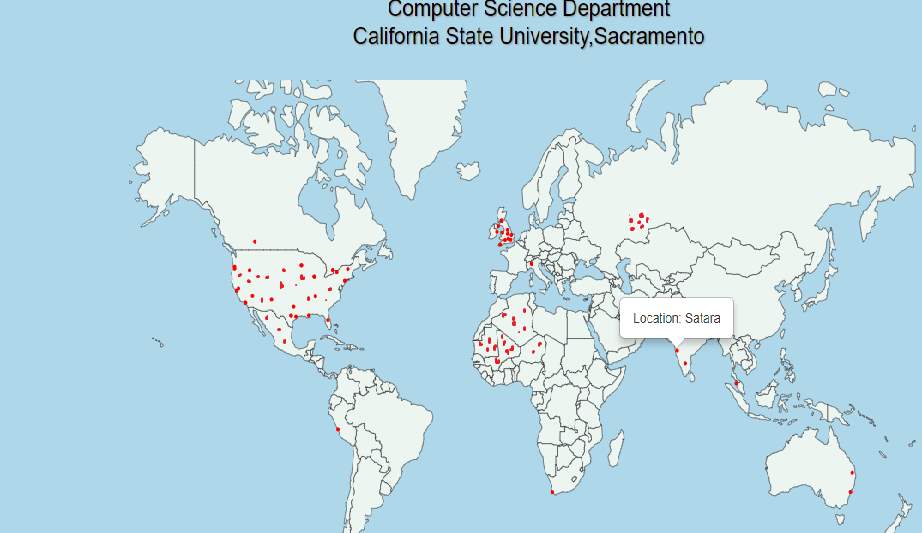
Figure 30. Last one-month Geo-tagged allergy tweets
Credible tweet and total tweet results
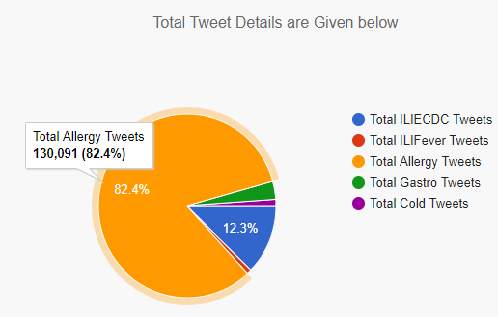
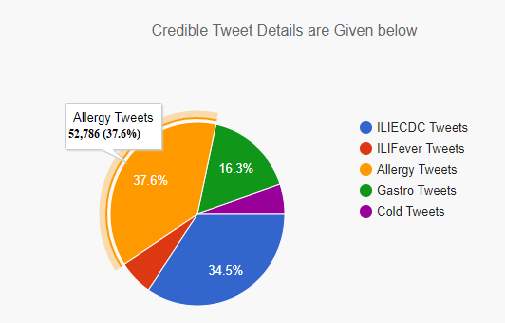
Figure 31. Comparing total no of allergic tweets to no of credible tweets
Crowd sourced data visualization
The no of user reports related to five disease like symptoms is shown on the pie chart in fig 32 along with the percentage of people received medication. The user reports related to five of disease at the zip code location 95825 is shown in fig 33. No of ILIECDC reports is more when compared to other diseases at this location
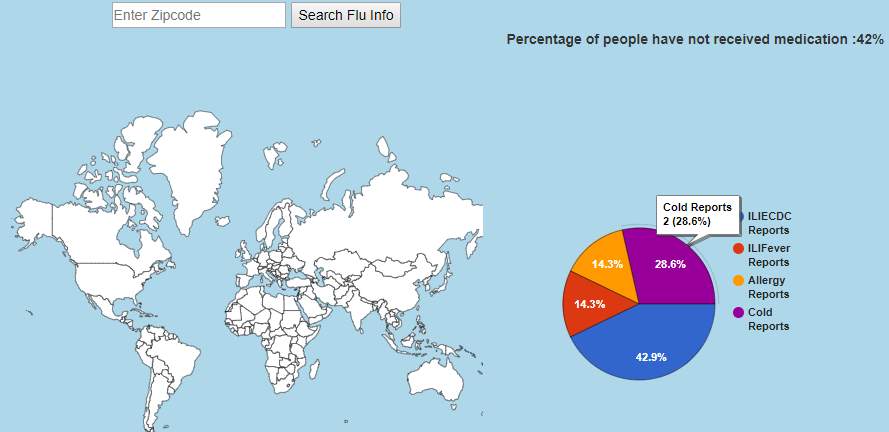
Fig 32. Worldwide five disease symptom reports
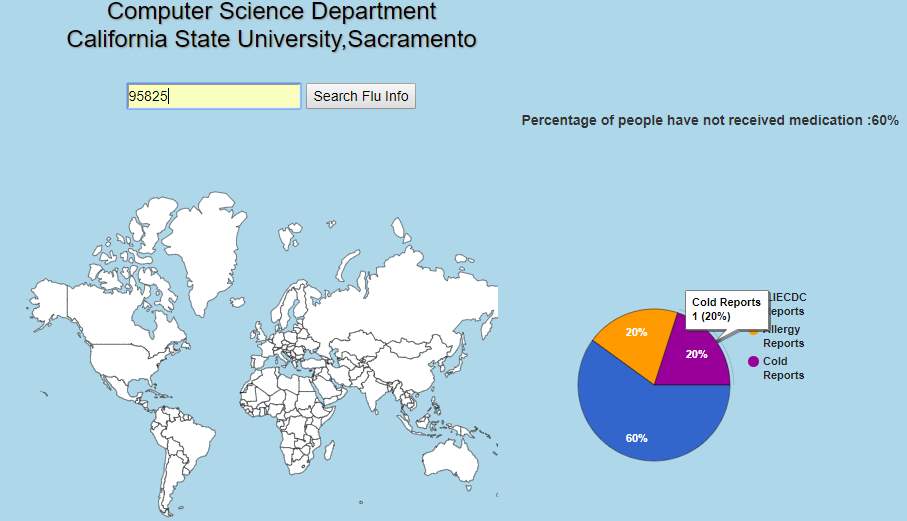
Fig 33. For specific zip code location five disease symptom reports
Chapter 7. Conclusion
Visual representation of any information can be processed by human beings at a faster rate and make better decisions. Analyzing and visualizing the disease related tweets using the tool developed can help the health care professionals and government to make early predictions about a disease outbreak, issue appropriate warning and eradicate the spread of diseases by taking necessary actions.
In our analysis, at a duration of time it was observed more tweets related to allergy and influenza were posted and geo-tagged tweets showed increased activity of allergy and influenza like illness in most of the locations in U.S and world-wide for a certain period. Authenticity of posted tweets were also analyzed using sentiment analysis by calculating polarity values. With this method
One of the components developed, makes the tool act as a crowd sourcing platform to create situation awareness and it’s an attempt to gather the real time data from the people who are affected by disease and people who are interested in providing details about the disease affected areas. With the help of crowdsourced data, rescue operations and medical aid can be provided to a location affected heavily by a disease at a faster pace. Although, the credibility of crowdsourced data is low, as it’s not a formal way of collecting information, but it can help in rescuing thousands of lives during a disease wide spread. The false positive values in the crowdsourced data will also be considerably low, as only people who are affected by a disease and who are aware of the situation can provide such pertinent details.
Chapter 8. Future Work
In this project, the power of visualization techniques and its impact in time critical situations to make informed decisions was depicted using d3.js visualization framework and Google’s visualization API’s. Sentiment analysis was also done for determining the credibility of disease related tweets. The tool has different components and it can be enhanced to include few more functionalities. Following are some of the improvements that can be made to tool:
- Currently, the tool is able retrieve tweets related to only five pandemic diseases and predictions are made to only those five diseases. In future, a tool to automatically retrieve tweets related to various diseases would be highly beneficial.
- At present, type of disease, the date when the illness started, zip code of location from where the person is providing information is crowdsourced. As a future enhancement, nearest medication centers information can also be collected via crowdsourcing which can help in providing medical aid in emergency situations.
- Currently, sentiment analysis is carried out by calculating polarity values for credibility. In future, sentiment detection can be done as classification problem to improve the accuracy by using SVM or Naïve Bayes classifier for credibility analysis
Appendices


Cite This Work
To export a reference to this article please select a referencing stye below:
Related Services
View all


Related Content
All TagsContent relating to: "Social Media"
Social Media is technology that enables people from around the world to connect with each other online. Social Media encourages discussion, the sharing of information, and the uploading of content.
Related Articles

DMCA / Removal Request
If you are the original writer of this dissertation and no longer wish to have your work published on the UKDiss.com website then please: