Performance Analysis of Micro Gas Turbine
Info: 11430 words (46 pages) Dissertation
Published: 10th Dec 2019
Tagged: Electronics
ABSTRACT
The energy market is on an all-time high thanks to the globalization and the privatization of the sector. In times like Micro-CHP offers some of the most promising technologies. Heating and the generation of electricity from a common source where there is a minimal loss of the generated heat is a great idea to preserve resources and the companies are vying to emerge as a leader by competing in a big market. Higher efficiencies with a single fuel source is widely considered as the major reason for the boost in development of the mCHP systems. The aim of the project is to conduct a comprehensive study on the performance development of the mCHP systems.
Initially the literature research offers some insights into the history and the current trends of the Micro Gas Turbine Systems. The technologies used and working principle is also discussed. Based on this a further research involved with the manufacture of the Turbine System of the mCHP is analysed. Moreover, since the micro turbine applications are still in the development phase, various tests are carried out in developing a design space for the calculation of the parameters affecting the most important parameters like Isentropic Efficiency and torque developed by the turbine.
Overall, the study shows that from an efficient and economic point of view the optimum manufacturing process which can be used for the manufacture of the turbine rotor and stator blades.
Keywords:
Micro-CHP, Surface Roughness, Turbine Blade Roughness
I would like to thank my supervisors Dr. Theoklis Nikolaidis and Gamil Abdelaziz for their outstanding support and effort in helping me understand the basic principles of performance of gas turbines.
I would also like to express thanks to my Course Director Dr. Nalianda for his support and advice, not just during the thesis period but also regarding personal issues.
Also, the backing from my friends Oscar Arechavaleta Bastida, Miguel Mazzucchelli, Aaron Butler and Elvis Madamombe has been invaluable.
Lastly, I would like to heartfully thank my friend Ahmed Mansour for his exceptional help with the understanding of the Ansys CFX processes without which this thesis would have never been possible.
TABLE OF CONTENTS
2.2 Construction of Micro Gas Turbines
10 Conclusions and Further Work
LIST OF FIGURES
Figure 1: Global Power Consumption
Figure 2: Micro Gas Turbine Shaft
Figure 3: Typical Micro Gas Turbine Cycle
Figure 7: Nozzle Guide Vane of Turbine
Figure 11: Outlet Duct Section
Figure 12: Total Power Deviation
Figure 13: Fuel Flow Deviation
Figure 14: Total Power vs T amb
Figure 16: Turbine Blade with Thermal Barrier Coating
Figure 17: Selective Laser Sintering Process
Figure 18: Die Casting Process
Figure 19: Extruding Mechanism
Figure 21: Polishing via Laser Ablation
Figure 23: A Rough Surface of an Arbitrary Profile
Figure 24: Comparison of Rrms Ra with respect to Rzd
Figure 25: Surface Roughness for Manufacturing Processes
Figure 30: Stator Blade Layers
Figure 33: Grid Independence Study for Smooth Wall
Figure 34: Isentropic Efficiency Variation
Figure 35: Power Output Variation
Figure 37: Turbomatch Parameters at 1200K TET
Figure 38: Turbomatch Parameters at 1150K TET
Figure 43: Constant Power Case-1
Figure 44: Constant Power Case-2
Table 1: Turbine Design Requirements
Table 2: Design Point Parameters
Table 3: Design Space Parameters
Table 4: Number of Elements in each Component for Case-1
Table 5: Boundary Conditions for CFX
Table 6: Exhaust Gas Composition
Table 7: Surface Roughness for Rough Wall Analysis
Table 8: Efficiency and Power Variation with Grid Size
| TET | Turbine Entry Temperature |
| m-CHP | Micro-Combined Heat and Power |
| RPM | Rotations per Minute |
| RMS | Root Mean Squares |
1 Introduction
The gas turbine, which has been used since the last five decades has been one of the most efficient ways for the generation of power for both airplanes and industrial works. The fossil fuel at the rate being used currently, is estimated to be completely depleted by 2050.
The EEA is an environmental agency that is responsible for the measurement of the energy consumption in the world. But, this does not include the energy produced and used for transportation as it is 32% of the total consumption, households and the industry is responsible for about 50% in the year 2012. The remaining of the energy consumed is through agriculture and services. These are the primary sources for the formation of greenhouse gases out of which the transport and industry account for 79%. [1]
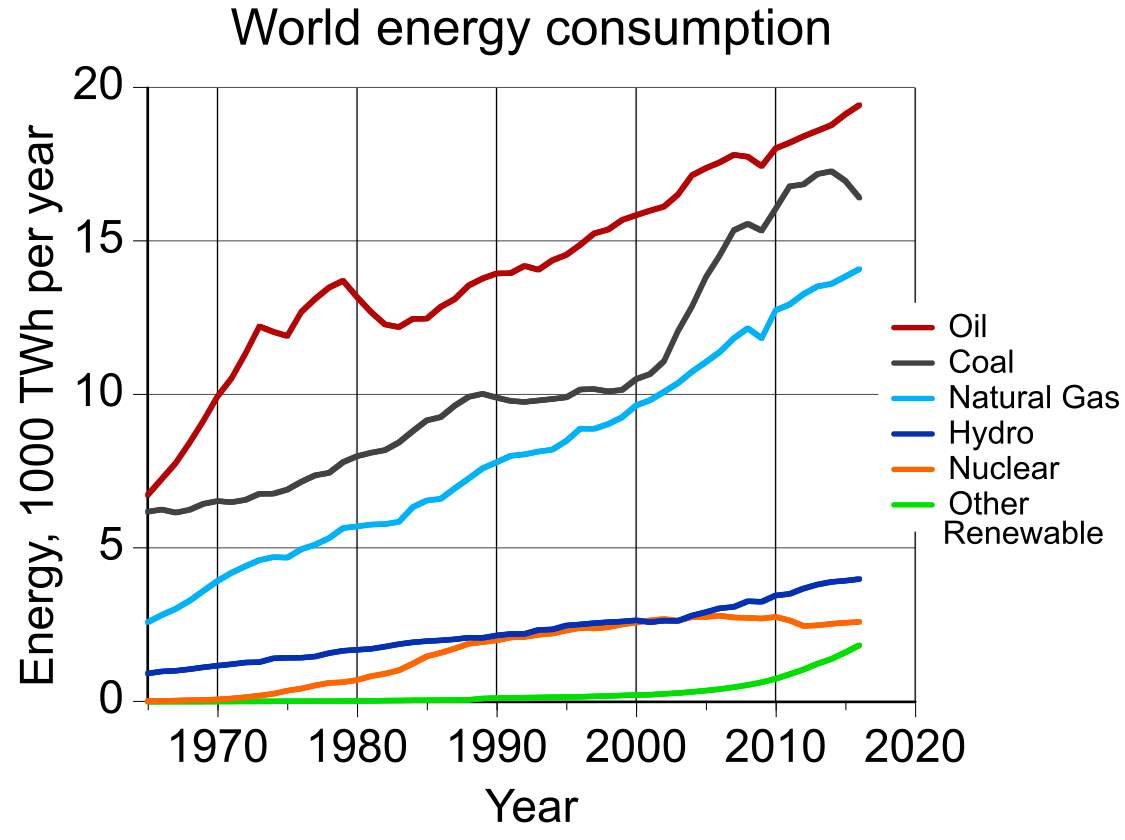
Figure 1: Global Power Consumption
Although there is a growing awareness regarding pollution and the effect of greenhouse gases, due to the rapid acceleration of reports pertaining to changing climates and the global warming, the industry still has a lot of ground to cover in controlling the emissions produced by them. According to a report by the EEA, “more than 70% of coal plants in the European Union are more than 20 years old and operate at an efficiency level of between 32–40%. Technological developments in the 1990s have allowed efficiencies in the range of 40–45% at newer plants.” [1]
The fuel that is burnt gives out heat which is usually wasted. This heat can be redirected and used for various heating purposes and thus the heat is used efficiently. This process is known as cogeneration.
Transporting electricity over very long distances using wires consists of losses. This problem can be alleviated by the idea of micro combined heat and power or micro-CHP or mCHP. Since the generators are connected directly to the small offices or buildings there is no transportation of energy required. This loss is thus overcome by the mCHP concept. “It also lacks the 10–15% energy losses from heat transfer in district heating networks due to the difference between the thermal energy carrier and the colder external environment.”. [2]
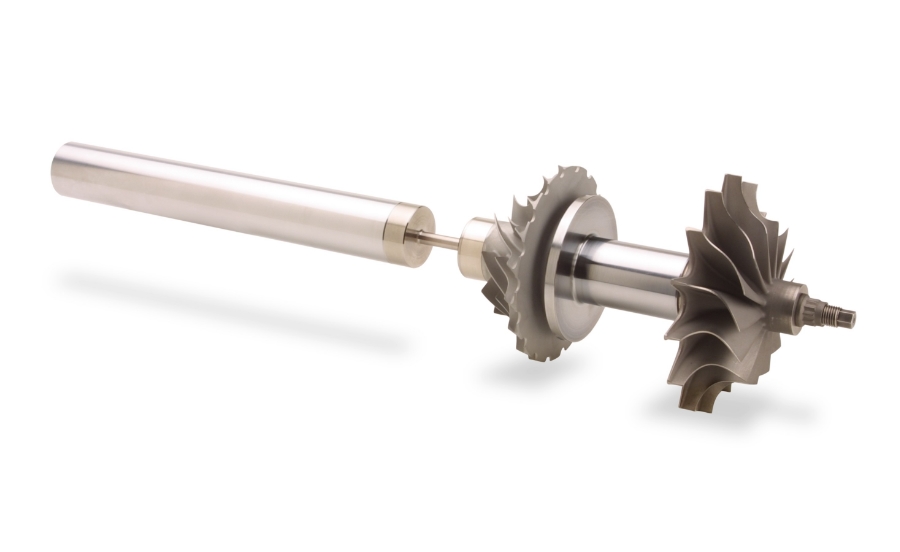
Figure 2: Micro Gas Turbine Shaft
These systems which is fuelled by natural gas is used for the production of heat and electricity. It consists of “a small fuel cell or a heat engine as a prime mover used to rotate a generator which provides electric power, while simultaneously utilizing the waste heat from the prime mover for an individual building’s heating, ventilation, and air conditioning.” [2] The engine can be used as an electricity delivery system as the primary or with electricity and heat as the secondary product. If used only for heating, excess electricity can be produced which can be sent out with respect to the demand in other storage locations as well. [2]
1.1 Objective
The objective of this thesis is to determine the optimum manufacturing process that can be used for the manufacture of the turbine blades with the lowest surface roughness to cost ratio. This is done by estimating the surface roughness of the blades using Ansys CFX and correlating these values with present literature. Also, the cost of manufacturing needs to be taken into consideration for the different processes involved which can determine the best one as required.
As the mCHP gas turbines’ primary usage is the generation of power and heating, a parametric analysis of the engine is warranted. This includes, but not limited to, the varying operating conditions such as hot and cold days, varying load conditions and an analysis of the variation of fuel flow and power output during these conditions.
The preliminary performance values of the micro-gas turbine were given by SAMAD Power. Further, a parametric analysis is done using Turbomatch, an in-house performance analysis tool of Cranfield University. Using Turbomatch gave a much clearer idea regarding the differences in the TET that can give the same amount of power output of 6.3 KW under varying operating conditions. This was tested in detail keeping the shaft speed and the TET constant. After this, the off-design performance calculations were done and an analytical analysis of the engine was done using Ansys Turbogrid and CFX to validate the results.
2 Literature Review
2.1 History
The micro gas turbine was a concept that started in the mid 1990’s when the miniaturization was in its early stages. Since the demand for smaller engines was desperately need in the energy sector, there were many attempts to achieve this. One of the most prominent ones was ‘The Millimetre Turbine’, which was attempted by a Professor of Aeronautics and Astronautics Alan H. Epstein who estimated “the possibility of creating a personal turbine which will be able to meet all the demands of a modern person’s electrical needs, just like a large turbine can meet the electricity demands of a small city.” [3]
This millimetre turbine which had the same components of a conventional gas turbine employed in large scale engines, but used a completely different manufacturing technology. According to Professor Epstein, “millimetre sized turbines also have many of the same design considerations as large turbines including basic layout, mechanical stress, oxidation-limit etc. In some respects, designing a micro size turbine is simpler than a conventional macro one since the micro rotors of the turbine are very stiff, eliminating bending problems which occur on larger rotors. Thermal stress is also not an issue at these sizes as well as maintenance of any kind (you will never fix a micro turbine but simply replace the entire engine).” [3]
2.2 Construction of Micro Gas Turbines
Applications requiring the configuration of a micro gas turbine usually consist of a “single-shaft microturbine, annular combustor, single stage radial flow compressor and expander, and a recuperator or not.” [4] Also, since the micro gas turbine has a very low-pressure ratio and very high rotational speeds due to the miniaturization of the shafts, the need to be optimized is very necessary. The usual range of the rotational speed of the micro gas turbine engine is approximately 90000-160000 rpm. [5]
The principle used in traditional micro turbines is the Brayton open cycle. “In this cycle, the air is compressed by the compressor, going through the combustion chamber where it receives energy from the fuel and thus raising its temperature. Leaving the combustion chamber, the high temperature working fluid is directed to the turbine, where it is expanded by supplying power to the compressor and for the electric generator or other equipment available.” [5]
Normally, microturbine cycles are used with or without recuperation. In order to produce the required efficiency, heat recovery must work within the turbine and the exhaust system preheats the turbine air supply while it re-enters the combustor, for regeneration. Net cycle efficiencies of almost 30% is achieved using this principle. In the case of non-recovery based systems the cycle efficiency can go up to 17%. [5]
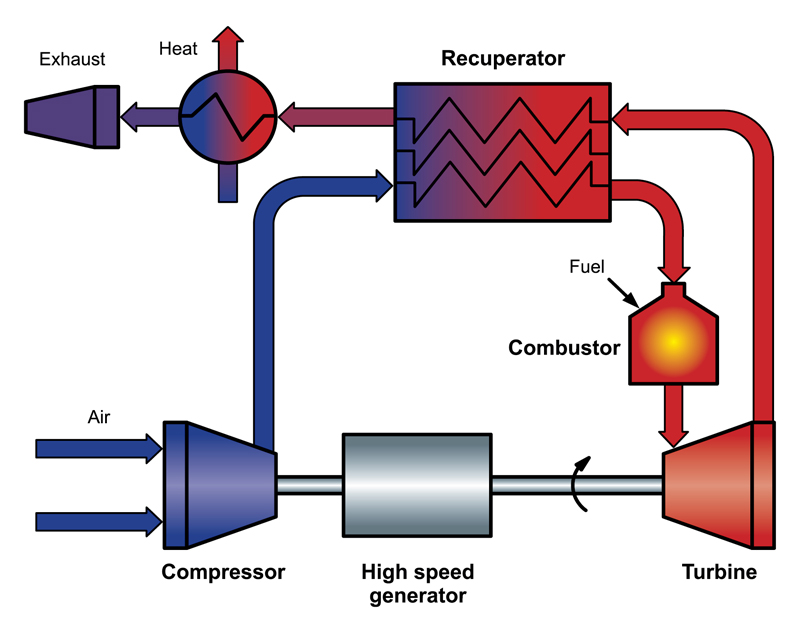
Figure 3: Typical Micro Gas Turbine Cycle
Magnetic variable speed alternators are also used for the generation of high frequency alternating currents which is converted using a rectifier to match the required supply frequency. [5]
3 Problem Statement
A major problem with CHP engines used for cogeneration is the turbine development. As it constitutes of very small parts, the need for perfect and meticulous design and manufacturing is high. This turbine represents part of TwinGen CHP engine. SAMAD Ltd, the leading designer of TwinGen Project, who has specified the targeted design requirements and parameters.
The requirements were set to design an axial turbine to drive a compressor, which has a pressure ratio of 2.7, and to generate overall power of 6.3 KW. A list of all design requirements is shown in Table 1.
Table 1: Turbine Design Requirements
| Parameter | Value |
| Turbine Entry Temperature | 1200 K |
| Inlet Mass Flow | 0.024 kg/s |
| Turbine Inlet Pressure | 273 kPa |
| Required Turbine Outlet Pressure | 104 kPa |
| Fuel to Air Ratio | 0.015 |
| Turbine power 6.3 kW | 6.3 kW |
| Compressor Pressure Ratio | 2.7 |
| Turbine RPM | 170 k rpm |
| Efficiency | 85 % |
These parameters are first used in the performance analysis using Turbomatch, an inhouse Performance Analysis software of Cranfield University. The values obtained are then correlated with the values given by the company.
3.1 Component Design
The components of the turbine are divided into four parts namely the Inlet, the Outlet, the Rotor and Stator Stages. These were pre-designed by the company SAMAD Power which was the previous stage of the project where the initial design was redesigned to accommodate the parametric requirements of the TwinGen Turbine. The mesh generation was done for this paper using Ansys Meshing for the Inlet and Outlet Ducts and Turbogrid for both the rotor and stator stages.
The turbine design was done by SAMAD Power in which they used many assumptions. In order to decrease the design time and the simplification of the design these assumptions were necessary. Some of them include:
• No radial velocity component
• Linear distribution of maximum rotor blade thickness
• Constant NGV blade thickness
• Constant NGV and rotor blades chord along the span
• Constant work along the span at rotor blade inlet
• Diameter of BGV and rotor trailing edges are 0.3 mm and 0.5 mm respectively
• Diameter of BGV and rotor leading edges are 0.5 mm and 0.6 mm respectively
• Axial velocity is not constant throughout the rotor blades
3.1.1 Inlet Duct
The Inlet duct was designed to guide the hot gases from the combustion chamber to the NGV blades. It is as shown in Figure 4.
It was cut into 15 sections for the ease in terms of computational power and time as shown in Figure 5.
3.1.2 Nozzle Guide Vanes
The thickness of the NGV blade was chosen to be constant along the span. The maximum thickness of the NGV blades was about 0.6 mm. A single blade of the NGV (Stator) is as shown in the Figure 6.
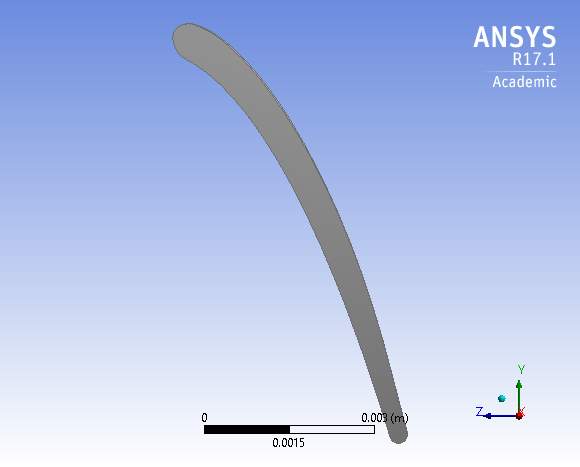
The nozzle guide vanes of the turbine section are as shown in Figure 7.
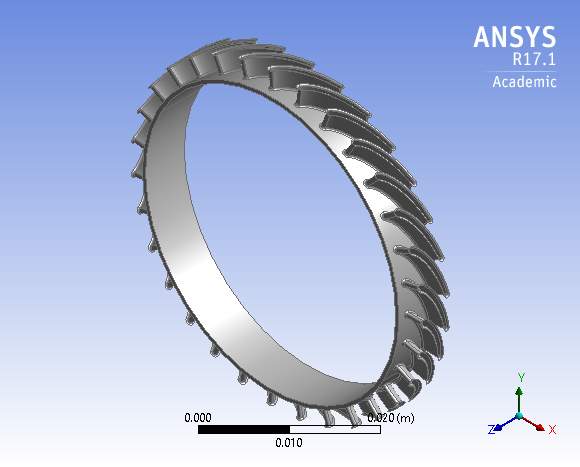
Figure 7: Nozzle Guide Vane of Turbine
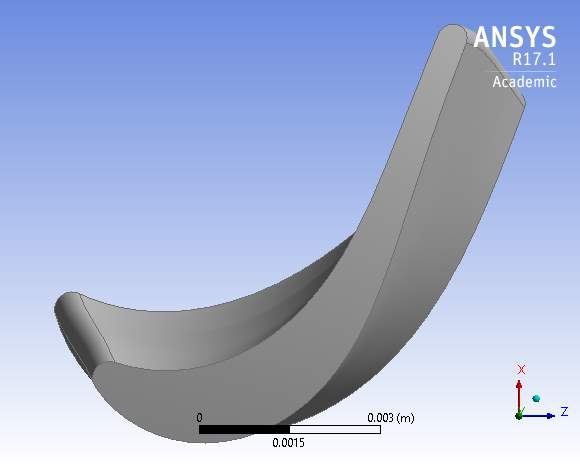
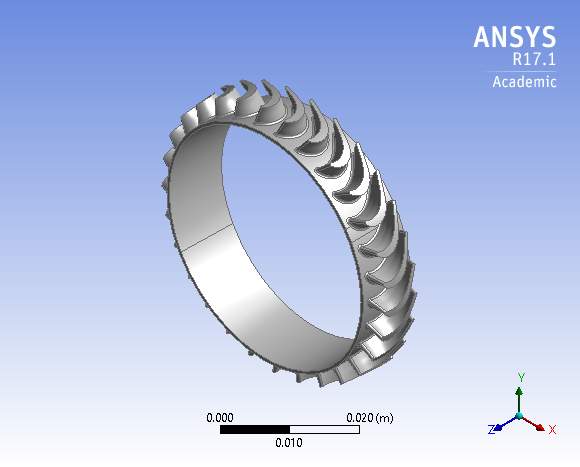
3.1.3 Rotor
The rotor has a linear thickness distribution between the root and tip the rotor blades, the maximum blade thickness near the hub and shroud was 2.3 mm and 2 mm respectively. The rotor blade is as shown in the Figure 8.
The rotor of the turbine stage is as shown in the Figure 9.
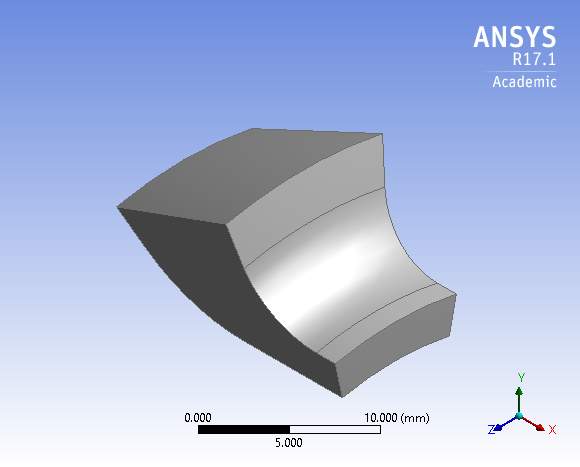
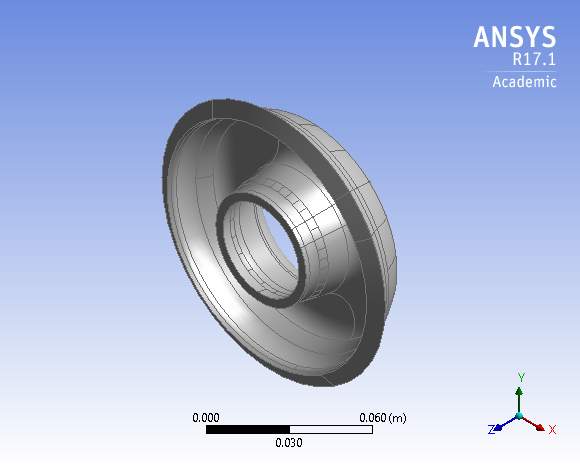
3.1.4 Outlet Duct
The outlet duct was designed in to eliminate and separate the reverse flow regions and to ensure the flow is directed properly towards the heat exchanger. The outlet duct is as shown in Figure 10.
It was then, like the Inlet Duct cut into 19 sections for the CFX Analysis as shown in Figure 11.
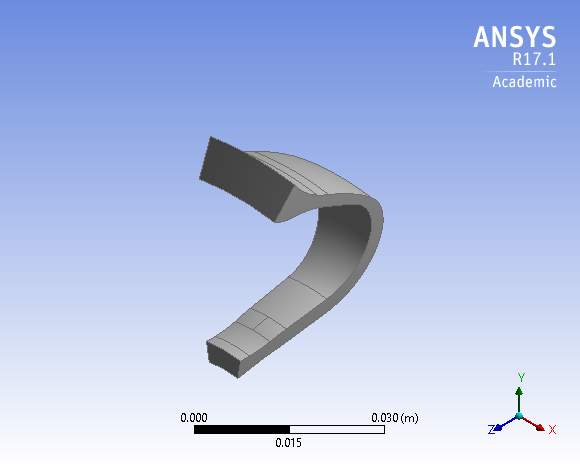
Figure 11: Outlet Duct Section
4 Performance Analysis
The performance analysis in the initial stage is done using Turbomatch, a Cranfield University in-house performance analysis software.
Effective analytical analysis is necessary, at design point as well as the off-design conditions as the results should be matched with the advanced numerical simulations obtained from commercial software like Ansys CFX.
The design point, when an engine is running at a speed, pressure ratio or mass flow, the point at which the engine is designed is known as the design point. These need to be established which can be used to determine the operating range of speed and power output that we obtain from the engine. This can be assumed as the off-design performance of the engine which is calculated for a range of conditions. [6]
During the design point and off-design simulations, the experimental data obtained from practical experiments or through previous experience can be very useful in determining the performance characteristics of individual engine components. This data is usually plotted together to form a ‘component characteristic’ or ‘component map’ that describes the overall component performance under a wide range of operating conditions. However, when individual components are linked together in an engine system, the range of possible operating conditions for each component is considerably reduced. When the engine is running at a steady state, or in ‘equilibrium’, corresponding operating points on the map (or characteristic diagram) of each component can be found.
4.1 Design Point Setup
Turbomatch uses an iterative method based on component maps. Initially the performance is estimated for the design point and the component maps are scaled for the same. Then, the off-design calculations are done and scaled automatically to the design point values. Throughout the process the mass and energy is conserved.
The first simulations were done for four different cases with different input parameters to match and validate the values given by the company, SAMAD Power. The values given by the company were done using the performance simulation software, Gasturb. All the four cases have different compressor and turbine efficiencies, pressure ratios and air mass flows. The details regarding this has been described in detail in Appendix A.
After the matching of the parametric values, they are used to run various iterations to check for the most important design requirements, Generated Power, Nozzle Exit Area and Mass Flow with a constant Turbine Entry Temperature (TET) and Rotational Speed while maintaining a design efficiency of 85% of the turbine.
For the matching of the parameters at design point, we use the following boundary conditions and parameters as outlined in Table 2. The other parameters of the engine can be found in Appendix A.
Table 2: Design Point Parameters
| Parameter | Value |
| Turbine Inlet Temperature | 1200 K |
| Inlet Mass Flow | 0.02 Kg/s |
| Fuel Flow Rate | 3.3E-04 Kg/s |
| Bleed Air | 0.002 Kg/s |
| Pressure Ratio | 3.0 |
4.1.1 Design Point Results
The values obtained from the design point simulation done using Turbomatch is matched to the GasTurb values as given by the company. The most important parameters such as the Total Power and the Fuel Flow Deviation are as shown in Figures 10 and 11 respectively, where the four points correspond to the four cases as given in Appendix A. Several other parameters including the Nozzle Exit Area, the Rotor Outlet Pressures and Temperatures are referenced in Appendix-A.
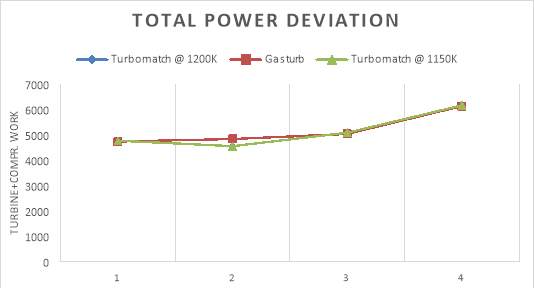
Figure 12: Total Power Deviation
As we can see there is a very slight deviation in the results of both Turbomatch using 1200 K or 1150 K as the turbine entry temperature. Since these match the parameters through GasTurb, we can use 1150 K as the TET for the numerical analysis.
This further has the advantage of using lesser fuel to produce a little lesser, albeit the required amount of power. This also increases the life of the turbine blades as they are exposed to lesser metal temperatures.
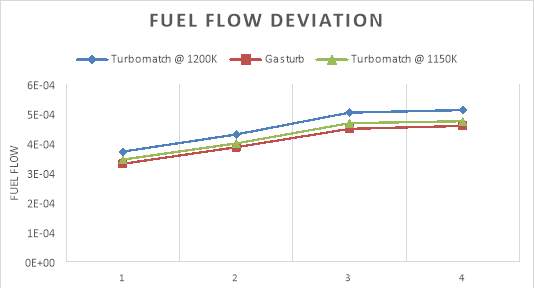
Figure 13: Fuel Flow Deviation
The results of these design point simulations are further analysed in the off-design simulations for variations in the inlet temperatures such as a hot and cold day, load conditions where the power generation is the crucial factor.
4.2 Off Design Setup
As stated in Section 4.1, to calculate the off-design performance of any gas turbine engine the Turbomatch program uses component maps.
The first calculation is always Design Point to determine the scaling factors for maps. To change any input conditions, we can define changes in the ambient temperature, the nozzle areas or the bleeding flow.
The off-design calculations were done for the same shaft rotational speed of 170K rpm which has an impact on the TET of the engine. The cases were also run for a constant TET which are discussed in Appendix A.2.
Some conditions were assumed using the results from the design point calculations and the off-design parameters such as varying ambient temperatures, constant rotational speed, and constant power output. As the micro gas turbine is expected to operate under a variety of temperatures and power load requirements, this is done to ensure the minimum power output is achieved.
4.2.1 Off Design Results
As we can see in Figure 12, the total power decreases as the ambient temperature increases. This gives us a rough estimate of the power output delivered during hotter days versus colder ones. Also, as we can see the turbine generates the required amount of power in all the conditions which is a core requirement.
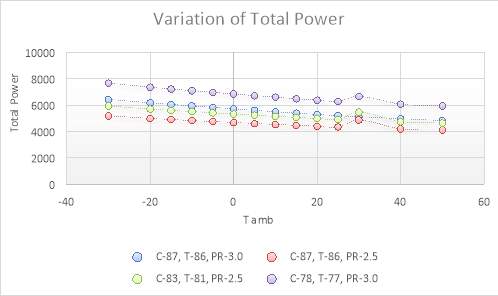
Figure 14: Total Power vs T amb
In Figure 13, we see the variation of Fuel Flow versus ambient temperature.
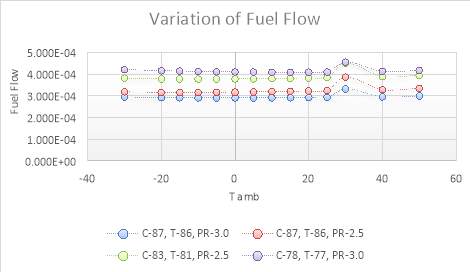
As the off-design calculation was done at 30ºC and at 20% humidity, the engine shows an increase in the total power output and the fuel flow as shown in Figure 12 and 13. The other parameters of the off-design performance simulation are highlighted in Appendix A 2.
5 Design Space
From the values obtained in the design point and the off-design calculations we need to assume a design space where we achieve the optimum values based on the requirements. These values are used as the boundary conditions for the Numerical Analysis done in the later section of the paper. These values need to be within a certain range of the required parameters.
5.1 Design Space Parameters
The following values are obtained and chosen as the design space for the input of the boundary conditions for the CFX analysis. A maximum deviation of 5%, according to literature between the analytical and the numerical solutions is considered valid.
Table 3: Design Space Parameters
| Parameter | Value |
| Turbine Inlet Temperature | 1150 K |
| Ambient Temperature | 273.15 K |
| Humidity % | 0 |
| Inlet Mass Flow | 0.028 kg/s |
| Pressure Ratio | 3.0 |
6 Manufacturing Processes
6.1 Materials Used
Materials used for the manufacture of turbine blades are mostly cost dependant. These costs can vary based of the following factors.
- Quantity
- Production Method
- Material
- Blade Geometry (profile shape, twist etc.)
- Blade Fastening
- Blade Size
- Surface Quality
- Tolerances
This paper is only going to deal with the last two points, which are surface quality and tolerances for the manufacture of the same. Flow analysis is necessary as the surface roughness of the manufactured blade is responsible for the direction and guiding of the air. Since a certain minimum surface roughness is required for the proper functioning of the blade, with respect to their efficiencies and power delivery we need to make sure that the roughness is within the preferred parameters. Also, the type of manufacturing process used for the turbine blade is important to study as they degrade over time and we need to estimate this degradation too.
In this thesis, however, just the blade roughness is estimated and the results are presented. “In addition to the permissible surface roughness, the production of turbine blades must also observe certain tolerances regarding the shape of the blade profiles. Deviations from the specified profile can occur in a relatively uniform form, e.g., through wear by the cutter during copy-milling, through wandering of the die during forging or through uncontrollable congealing during casting.”
As turbine blades are the most limiting components of a gas turbine, they need to be modelled perfectly which allows for proper energy extraction from the engine. The hot gases from the combustor flow into the turbine through the nozzle guide vanes which rotates the turbine and leads to the production of energy. As the turbine blades need to work and deliver in such a hostile environment, the turbine blades are fitted with top class materials which have very high heat resistance capacity such as super-alloys. They also employ cooling methods “such as internal air channels, boundary layer cooling, and thermal barrier coatings.” [7]
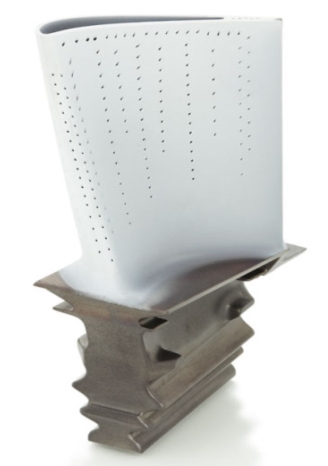
Figure 16: Turbine Blade with Thermal Barrier Coating
Direct solidification and single crystal production is also considered a major breakthrough in terms of blade production. As described in the following sections, the grain orientation and quality also increases the fatigue strength and creep resistance. [7]
6.2 Types of Manufacturing
For the manufacturing of the turbine blades various manufacturing processes can be used which have their own pros and cons. In this thesis, we will study in detail the following manufacturing processes.
- 3D-SLS
- Die-Casting
- Extruding
- Forging
- Milling
- Polishing
6.2.1 3D-SLS:
Additive manufacturing techniques are the up and coming technologies which aim at low cost of manufacturing and development. 3D printing is of many various types. Among them, SLS or Selective laser sintering is a very highly used process which uses a laser as its primary power source. This laser is incident on a powdered material in space which defines the 3D model for the manufacturing. Next, the binding of the material together is done to establish a solid structure.
Like direct metal laser sintering, which uses a similar technique to build the 3D space, SLS also has the same process but varies with minor details. Selective laser melting also uses a similar concept, but is distinctive of the material being fully melted rather than sintered which allows for editing the materials used in process. SLS is a relatively new technology that so far has mainly been used for rapid prototyping and for low-volume production of component parts.
Compared with other methods of additive manufacturing which used a small amount of the various materials available, SLS can produce parts from a relatively wide range. Polymer is the major materials used with different combinations of nylon or polystyrene. It is also done using metals including steel, titanium, alloy mixtures, and composites and green sand. [8]
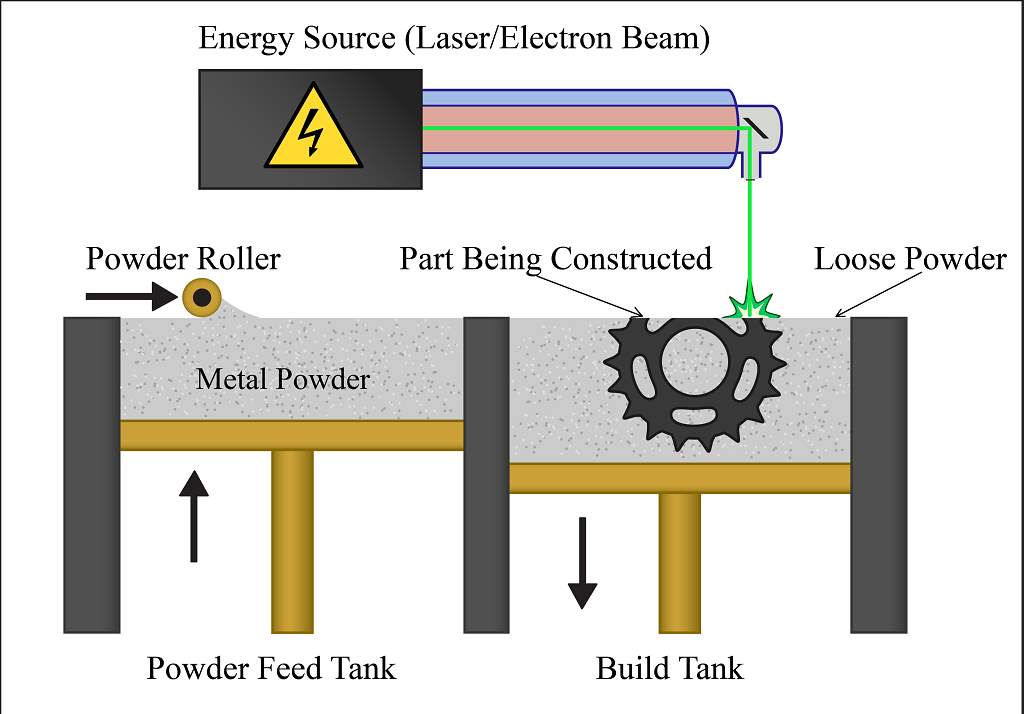
Figure 17: Selective Laser Sintering Process
6.2.2 Die-Casting
Die casting is a manufacturing process that uses molten die in liquid form which is poured into a mold or vessel and heated. As the molten material is poured into the desired vessel it can be chosen to form any given shape as per the requirements. It is a permanent mold manufacturing process which was developed in 1900. It is characteristic in terms of manufacturing processes as it utilizes a large amount of pressure which forces the molten metal through the mold. It is also highly used when we require a very high surface and dimensional accuracy. As the pressure used is very high extremely thin walls like that of turbine blades and nozzle guide vanes can be produced with ease. [9]
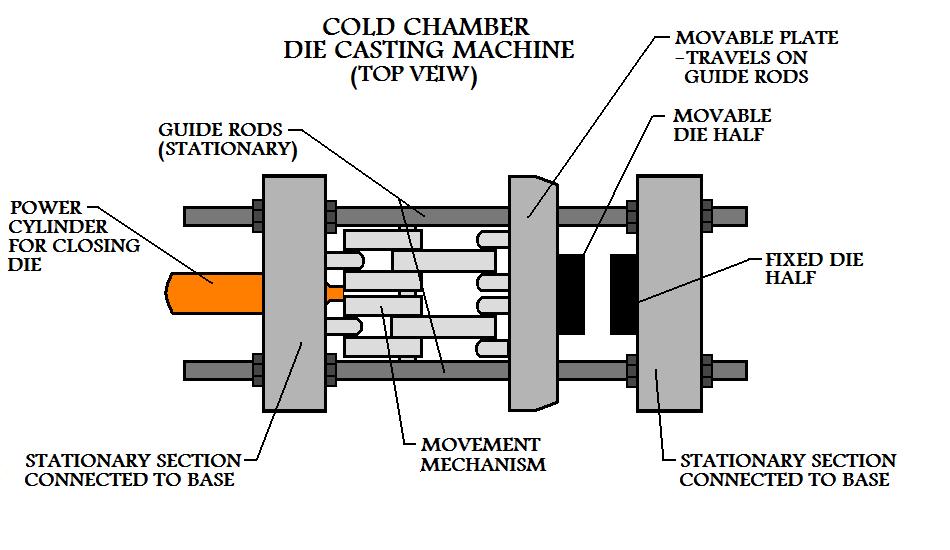
Figure 18: Die Casting Process
6.2.3 Extruding
In terms of metal forming processes, extrusion is done through which a work piece, of dimensions, is allowed move along a die of a smaller cross-sectional area. This will form the work to move to a new cross section. The new part’s length may vary but, it is dependent upon the type of material used for the process. Extrusion produces a uniform cross section. Usually, a round extruded part is used for this process. It is almost always used with parts which involve round cross sections. This is also used with hollow tubes or smaller diameter objects.
Hot or cold processes are used for manufacturing. Since extrusion is a forming process, like other metal forming processes, it can be performed either hot or cold. Depending on the manufacturing process used, hot or cold extrusion can be used. The choice for cold or hot process depends on the materials used. Softer and more malleable elements such as aluminium are done cold. Other materials such as cast iron which is more difficult to mold into shape must be worked hot. If the parts we need to manufacture are large, we use hot extrusion. It is also used when we need to produce materials of complex shapes. Cold extrusion of metal is usually used for smaller parts, less complex geometry, more workable materials and the manufacture of discrete extrusions that create a single part with each operation. [9]
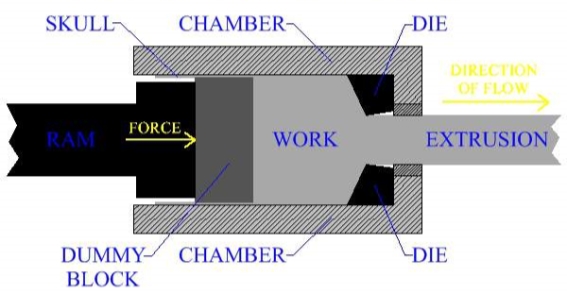
Figure 19: Extruding Mechanism
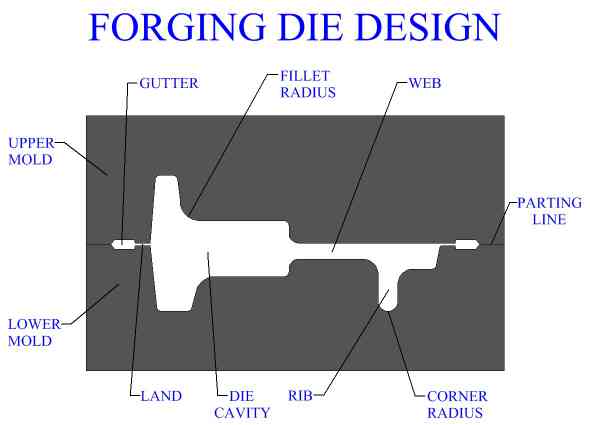
6.2.4 Forging
Application of mechanical energy to a material causes it to change its shape into solid state. For this process to work, the metal is first heated and then a force is applied which compresses the metal leading to plastic deformation. All materials are made up of tiny grain like structures which improve the properties of the material. With a proper compressive force incident upon the material, the flow of the grain like structures are oriented in the direction of applied principal stresses. Grain flow which can be determined by the pattern of the crystals which align themselves on the direction of the applied force during the deformation process either plastic or elastic. For a better forging process to take place, in which the physical properties of the material namely the strength, ductility and toughness, the crystals should be randomly oriented which allows for better performance of the material.
Most of the modern industry products, such as critical parts relating to an aircraft which include but not limited to, the landing gear, shafts for turbines and the structural components which are used in the manufacture of transportation equipment are done by forging. Also, the crank shafts, nuts, bolts and rivets are also usually manufactured by this process. As the forging die is cost effective, this is very viable in the production of small quantities of the parts which can also be produced on a price per unit basis. Only the setup of the forging die and the manufacturing materials are expensive. But once it is set up, it is relatively cost effective and most of it is automated which makes it easy for large quantity manufacturing. [9]
6.2.5 Polishing
Most industrial processes that are used in manufacturing must be aligned with surface finishing so that we get improved appearance, adhesion, along with corrosion, tarnish and chemical resistance. It also improves the wear resistance, enhances the electric conductivity and hardness. As most of the manufacturing processes give rise to surface roughness, in which case, polishing is touted as the best form of post processing such that the original dimensions of the workpieces are retained after the process. Polishing can also help in damage resistance.
Laser Ablation is a process that is used in burr removal on the surface. It is the process which involves the removal of material using irradiation from a solid surface. Sometimes a lower laser flux is used to heat the material which absorbs it and evaporates or sublimates. When used with a higher flux plasma is formed. Usually, laser ablation refers to removing material with a pulsed laser, but it is possible to ablate material with a continuous wave laser beam if the laser intensity is high enough. [10] “Processes are currently being developed to use laser ablation in the removal of thermal barrier coating on high-pressure gas turbine components. Due to the low heat input, TBC removal can be completed with minimal damage to the underlying metallic coatings and parent material.” [10]
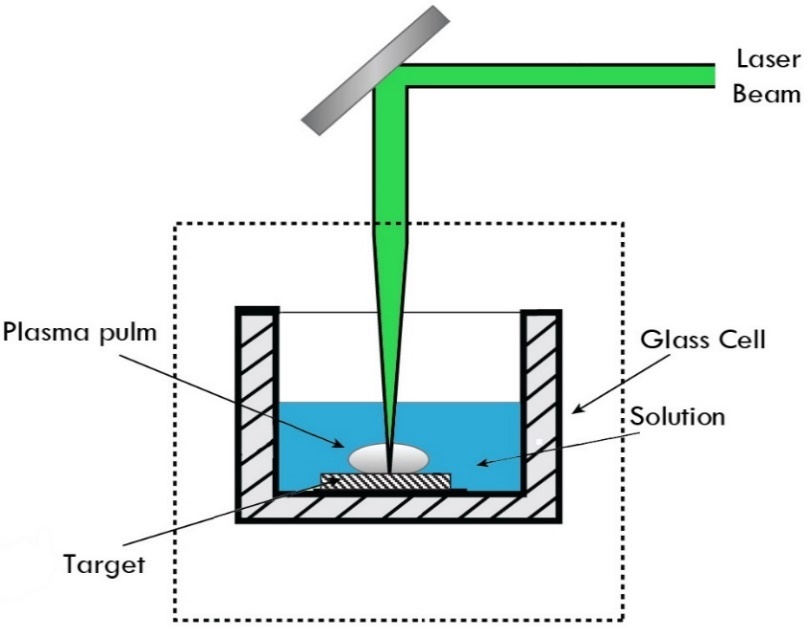
Figure 21: Polishing via Laser Ablation
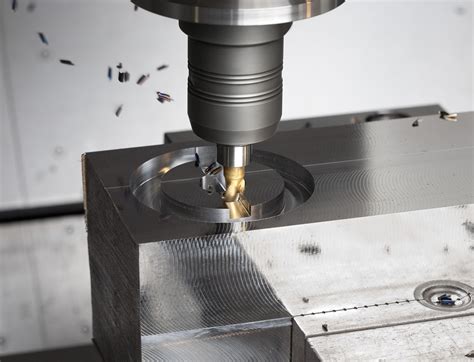
6.2.6 Milling
In terms of cutting processes, Milling is one of the most important techniques used which is used to remove material from the surface of a workpiece. The milling cutter is a rotary cutting tool, often with multiple cutting points. Instead of a rotational axis cutter, the cutting tool is usually placed normal to the surface of cutting. In drilling, unlike milling, this tool is used to remove the surface layer allowing it to shave off chips which is also called as “swarf” from the piece.
The cutter used in milling is usually repeatedly pushed into the workpiece such that the cutting edges also known as ‘flutes’ or ‘teeth’ help in removing the chips. As the tool passes normal to the surface, this results in shear deformation of the material surface. As the material is pushed away from the surface, tiny clumps that remain are used to form the chips. As metal is harder than other materials that are used as the tool piece, this form of cutting makes it easier than others allowing for more cost benefits in terms of usage. [11]
6.3 Surface Roughness
Surface roughness often shortened to roughness, is a component of surface texture. It is quantified by the deviations in the direction of the normal vector of a real surface from its ideal form. If these deviations are large, the surface is rough; if they are small, the surface is smooth. In surface metrology, roughness is typically considered to be the high-frequency, short-wavelength component of a measured surface. However, in practice it is often necessary to know both the amplitude and frequency to ensure that a surface is fit for a purpose. [12]
A roughness value can either be calculated on a profile (line) or on a surface (area). The profile roughness parameter (Ra, Rq) are more common. The area roughness parameters (Sa, Sq) give more significant values [12]
In terms of engineering surfaces, roughness is detrimental to part performance. Consequently, most manufacturing prints establish an upper limit on roughness, but not a lower limit. An exception is in cylinder bores where oil is retained in the surface profile and a minimum roughness is required. [12]
Although, several different parameters have been defined to characterize the roughness of surface. By far the most common is the arithmetic average of absolute values [13] which is shown in Equation 1.
Equation 1: Arithmetic Average of Absolute Values
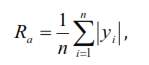
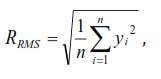
Where yi is the distance from the average height of a profile (the mean line) for measurement ‘i’, and n is the number of measurements. Two other parameters considered in the present work are the root mean squared and the peak-to valley values as shown in Equations 2 and 3.
Equation 3: Peak to Valley Values
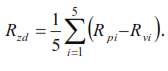
In the peak-to-valley parameter Rpi and Rvi refer to the largest distances above and below the mean line for one of five measurements, all equal scan length in the x-direction. [13]
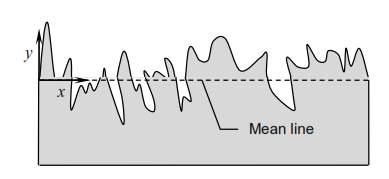
Figure 23: A Rough Surface of an Arbitrary Profile
The Figure 23 below shows the surface roughness as observed after certain manufacturing processes. These values of the roughness will be used to determine the optimum process to be used with respect to the cost ratio.
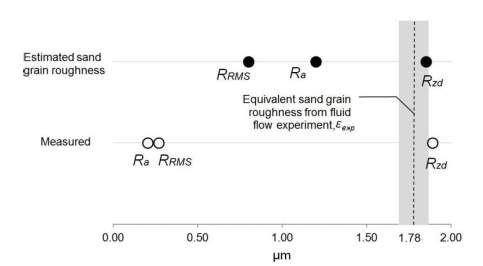
Figure 24: Comparison of Rrms Ra with respect to Rzd
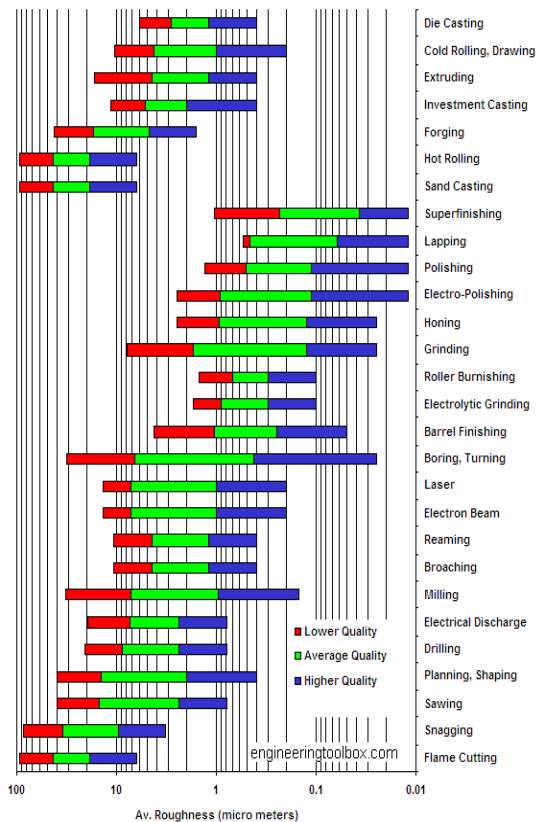
Figure 25: Surface Roughness for Manufacturing Processes
7 Numerical Analysis
7.1 Domain Setup
The numerical simulations were performed using ANSYS CFX 17.2. Ansys CFX is the leading software which is used among most of the industries. It is a very advanced and accurate tool for investigations of the flow structure inside rotating machines.
The numerical solution was obtained by solving the Reynolds-Averaged Navier-Stokes equations (RANS) using the finite volume method to solve the fluid model. The Shear Stress Transport (SST) turbulence model was selected, and no wall function was implemented in the numerical model. The wall for the initial estimation was chosen as a smooth wall with no slip. For further investigations, the wall was changed to a rough surface with varying roughness values.
7.1.1 Grid Generation
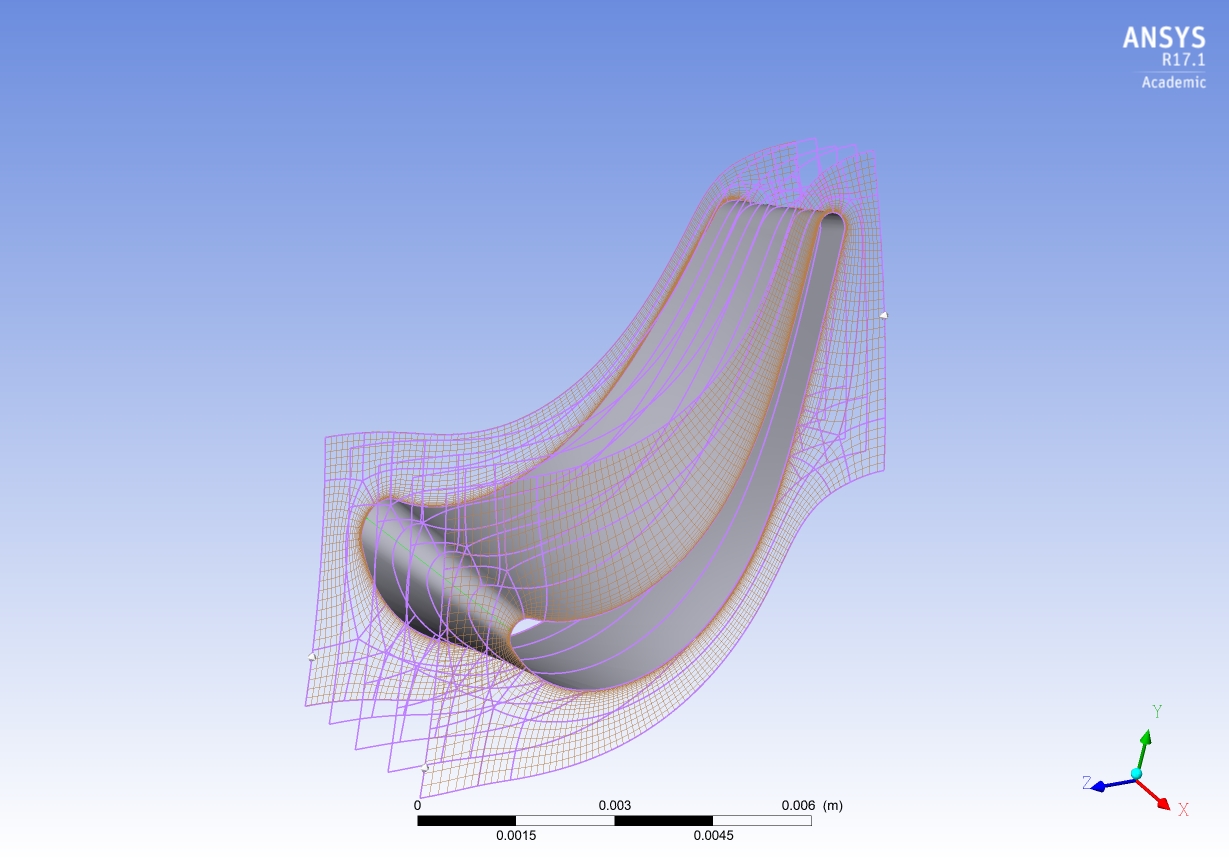
To generate the flow domain grid ANSYS TurboGrid was used for the rotor and stator blades while general ANSYS Meshing was used for the inlet and outlet as TurboGrid is a much better tool for turbomachinery elements. Figures 26 and 27 illustrate the structured fan rotor and stator grid which was used to obtain the numerical solution. The boundary layer used around the blade surface was 15% of the average blade mid-span thickness with a non-dimensional Y+ of around one. The tip clearance region was modelled with H-grid with 15 element nodes between the blade tip surface and the outer casing. The span of the flow passage was divided into 70 elements clustered near the hub and shroud walls. In reference to the smooth grid generation along the blade span, 3 layers were applied between the hub and the shroud as shown in Figure 28. Table 4 shows the number of elements in each individual component for Case-1. The other case mesh properties are shown in Appendix B.
Table 4: Number of Elements in each Component for Case-1
| Component | Number of Elements |
| Inlet Duct | 23577 |
| Stator | 62604 |
| Rotor | 67545 |
| Outlet Duct | 9450 |
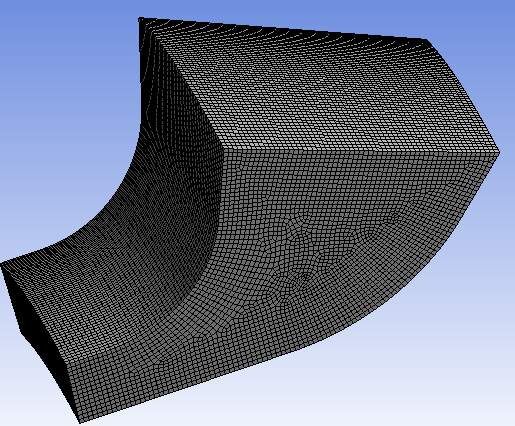
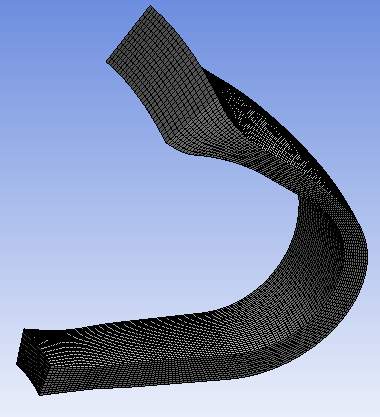
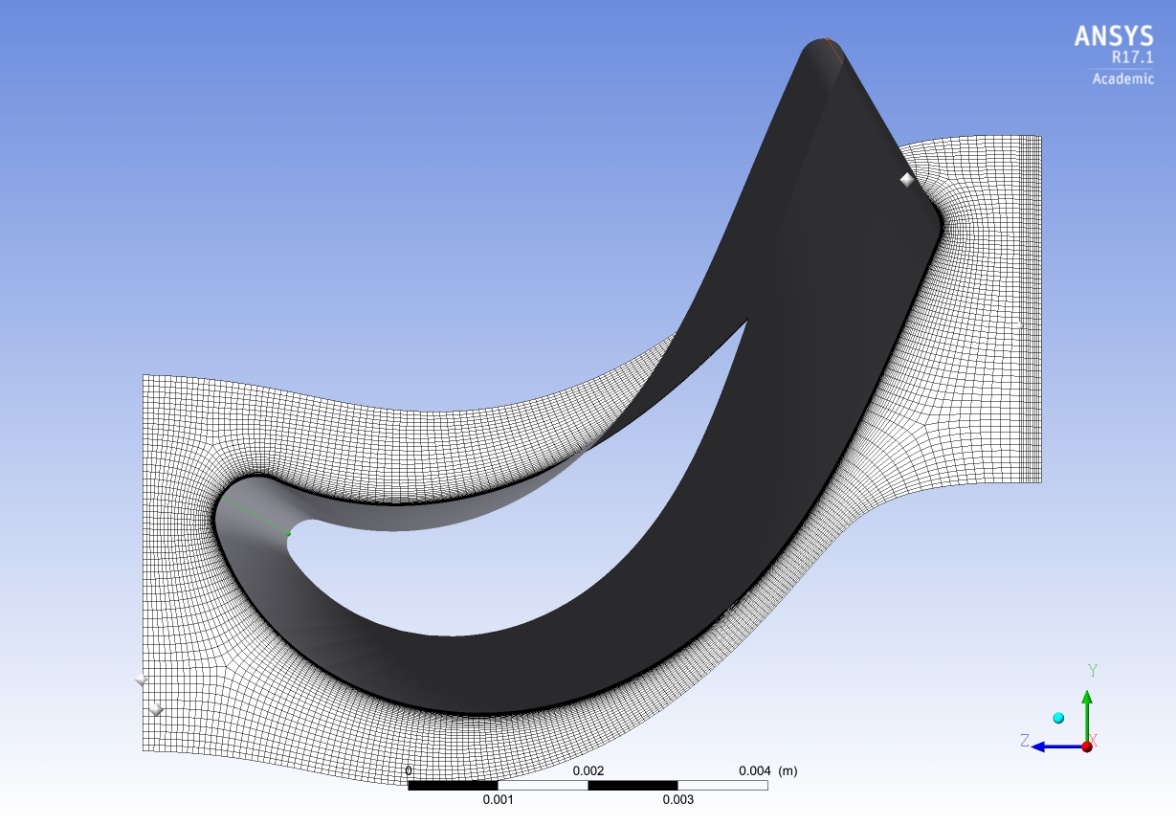
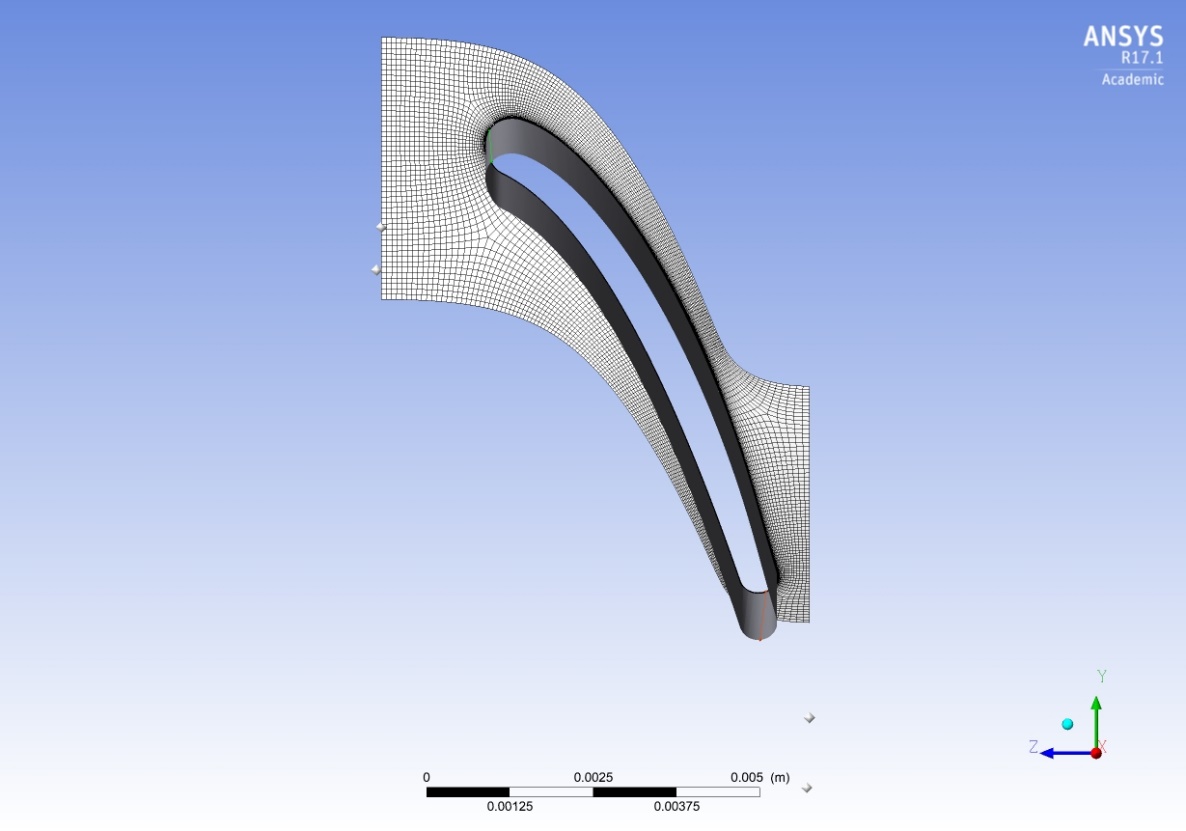
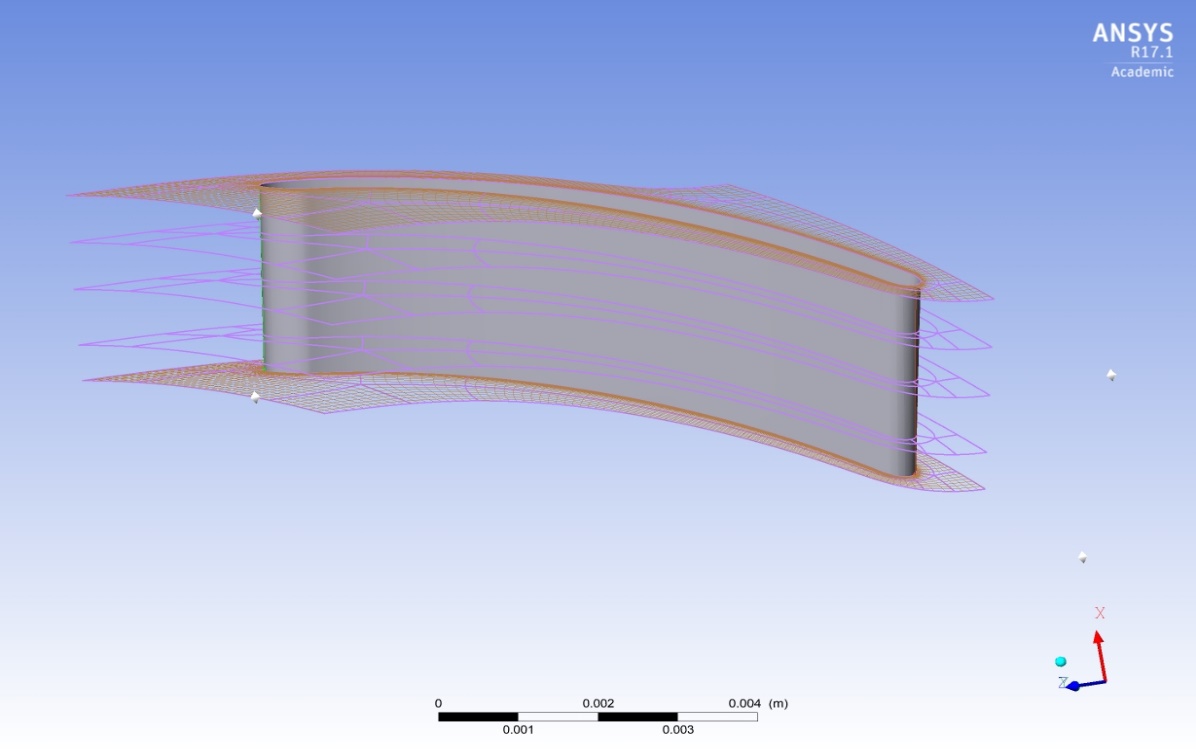
Figure 30: Stator Blade Layers
7.1.2 Physics Setup
The physics setup was of the Mixing Plane Model. A mixing-plane simulation is steady and only requires one rotor blade and one stator blade per stage. Between the rotating blade passage and the steady vane passage the flow properties are circumferentially averaged in a so-called mixing-plane interface. This will of course remove all transient rotor-stator interactions, but it still gives representative results.
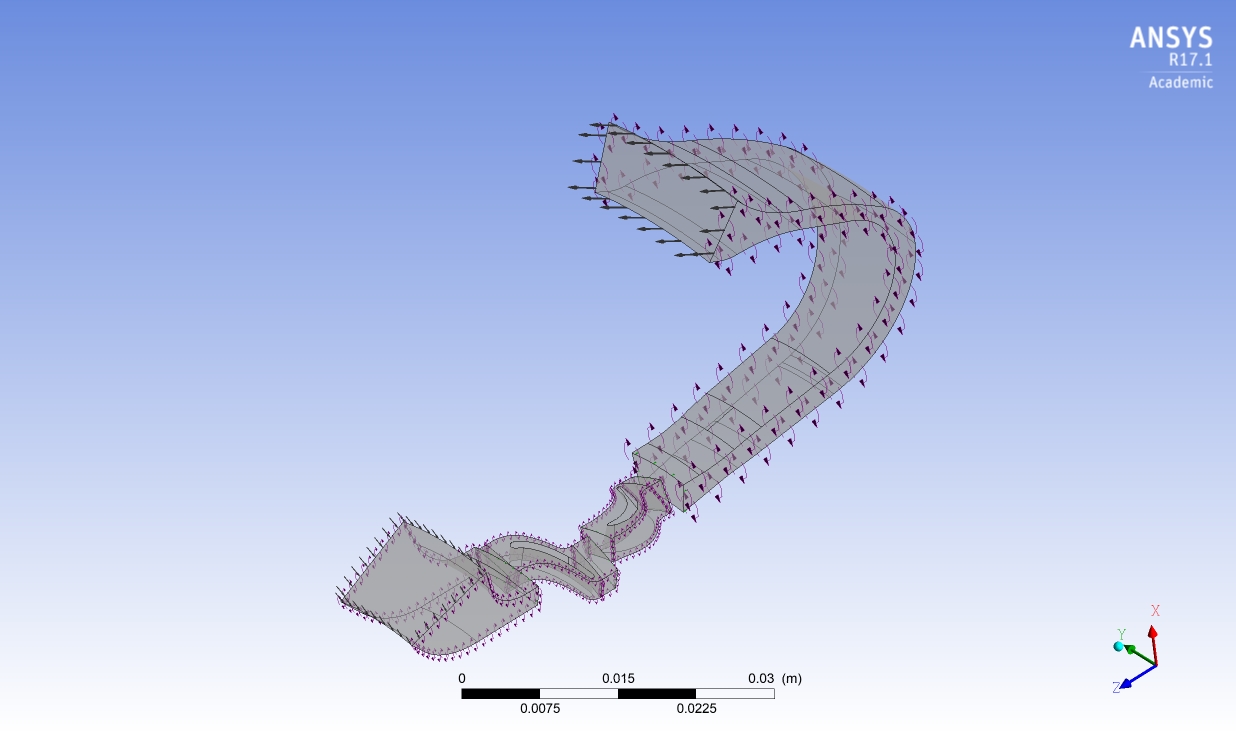
7.1.3 Boundary Conditions
CFD domain was generated by combining inlet, NGV, rotor, outlet flow fields as shown in Figure 30. The computational fluid domain included one rotor and NGV blade as well as a section of inlet and outlet ducts with periodic boundaries in the circumferential direction. The recommended inlet turbulence intensity for compressors and turbines, is normally in the range of 5% to 20%. Medium turbulence intensity of 10% and automatic length scale were assigned at the inlet of fluid domain.
The mass flow rate was specified at the domain inlet and the Static Pressure was used at the domain outlet. The boundary conditions for the rotor blade and hub were specified as a rotating wall in a fixed reference frame with the no-slip condition. The rotor shroud was specified as a counter-rotating wall in a fixed reference frame with the no-slip condition.
The interference between different domain was chosen to be mixing planes method. The numerical simulations were performed for different wall roughness in line with the manufacturing roughness as specified with a constant blade rotational velocity of 170,000 rpm. The boundary conditions used are shown in Table 4.
Table 5: Boundary Conditions for CFX
| Parameters | Values |
| Temperature Inlet (Total) | 1150 K |
| Per Passage Mass Flow | 0.001763 kg/s |
| Pressure Outlet (Static) | 88.6624 kPa |
| Number of Inlet Passages | 15 |
| Number of Outlet Passages | 19 |
The working fluid, the exhaust gas from the combustor was used which has the properties as specified in Table 6.
Table 6: Exhaust Gas Composition
| Gas Composition | Mass Fraction |
| CO2 | 5.32 % |
| H2O | 4.35 % |
| O2 | 15.12 % |
| N2 | 75.21 % |
7.1.4 Rough Wall
A similar process was undertaken and the walls of the rotor and the stator were assigned surface roughness values depending on the type of the manufacturing process used. The values used are outlined in Table 6.
Table 7: Surface Roughness for Rough Wall Analysis
| Process | Roughness (µm) |
| Die Casting | 0.8-1.6 |
| Extruding | 0.8-3.2 |
| Forging | 3.2-12.5 |
| Milling | 0.8-6.3 |
| Polishing | 0.1-0.4 |
| SLS | 11.2-17.2 |
In all the cases, the maximum values of roughness were taken such that we get a proper estimate when the process is at its lowest efficiency. This will give us the lowest possible monitor parameters of the turbine design.
7.2 Performance Report
Performance of axial turbine was calculated using ANSYS CFX macro. The performance was calculated using mass flow averaged of different parameters on inlet and outlet. The macro also estimates the output power by calculating the average torque on the blade multiplied by the total number of blades. The performance parameters of the turbine design are shown in Figure . The table shows static pressure and temperature as well as the enthalpy at inlet and outlet. In addition, the results show the overall power, power coefficient, and different total efficiencies.
The most important output parameters are the power outlet, total pressure at the outlet and total isentropic efficiency. The outlet values of these parameters are 6.3 KW, 104.075 KPa, and 81.4% respectively. The performance result confirms that the current design fulfils the required design parameters. Although the total isentropic efficiency is less than the required value, the deviation in efficiency is in tandem with the literature. This efficiency will further decrease when blade roughness is applied in numerical simulation but the maximum deviation that can be accepted is within 5% of the original required assumption of 85%.
8 Grid Independence Study
Although we have achieved a good convergence for a single solution we need to make sure that the grid doesn’t affect the solution in any way. Not checking this is a common cause of erroneous results in CFD, and this process should at least be carried out once for each type of problem that you deal with so that the next time a similar problem arises, you can apply the same mesh sizing. This way, we can ascertain that the results we have would be more accurate.
To carry out the grid dependency study, we run the initial case with the rough mesh to a residual convergence of 10-4 or in this case, 10-5. This ensures that all the monitor points are steady. Next, we increase the number of elements in the mesh and continue the same process until the mesh converges with less than 1% imbalance in the solution.
8.1 Smooth Wall
A temperature of 1150 K in line with the analytical analysis done on Turbomatch was used and the efficiency and power output was measured using the Gas Turbine Performance Macro in CFX Post. The grids were generated for differing number of mesh elements so the accuracy of the solution can be validated. After the point of the 6th case with the maximum number of mesh elements at 1404360, the change in efficiency and power output as shown in Chart 8.1 is almost negligible and we can assume that the output parameters are now independent of the size of the grid.
Table 8: Efficiency and Power Variation with Grid Size
| Mesh Size | Efficiency (%) | Power Output (kW) |
| 163176 | 81.4 | 8.06 |
| 399446 | 82.5 | 8.11 |
| 747956 | 83.5 | 8.18 |
| 986616 | 83.7 | 8.2 |
| 1182452 | 84.07 | 8.23 |
| 1404360 | 84.1 | 8.23 |
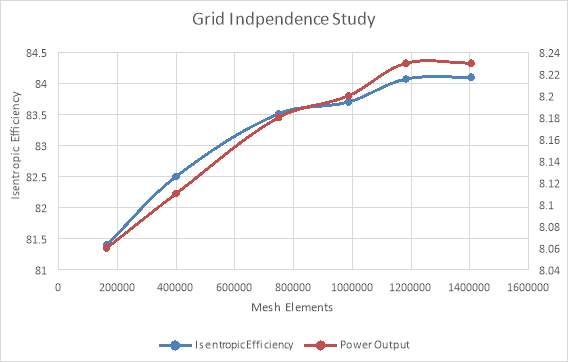
Figure 33: Grid Independence Study for Smooth Wall
The values after the maximum mesh were calculated and showed negligible deviation in the output. Hence, the mesh with the maximum elements was taken as the reference point for further calculations.
8.2 Rough Wall
The grid dependency study was repeated in the same process using the same number of mesh elements for varying roughness parameters. As discussed in Section 6.2 the roughness of the manufacturing processes was taken from literature and used to calculate the variation in the required parameters like Isentropic Efficiency, Nozzle Efficiency, and the Power Output.
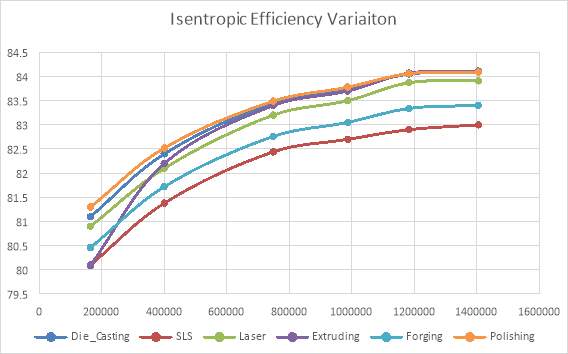
Figure 34: Isentropic Efficiency Variation
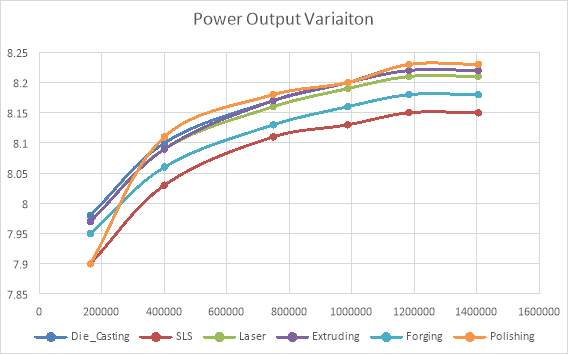
Figure 35: Power Output Variation
8.3 Performance Comparisons
The performance of the rough wall over the smooth wall is as expected with around 5% drop in the total isentropic efficiency. At the inlet and outlet of rotor blades as well as the total isentropic efficiency and power output it also shows the static and total pressures and temperatures in front of and after the rotating blades. The mean of the all the cases with different mesh sizes was taken as the reference for the efficiency and the power output calculations. It can be seen from
The maximum deviation between velocities of different analytical and numerical results were about 20%. The large deviation in velocities magnitudes where due to the complex flow structure inside the fluid domain. In addition, the numerical calculations were performed without considering the effects of different vortices inside turbine flow passage. In general, there is a reasonable agreement between analytical and numerical results which gives more confidence on the analytical methodology being used to perform the gas dynamic calculations.
Table 9: Deviation in Parameters
| Process Type | Efficiency (%) | Power Output (kW) |
| 3D-SLS | 82.08 | 8.078 |
| Die Casting | 83.14 | 8.15 |
| Extruding | 82.92 | 8.14 |
| Forging | 82.45 | 8.11 |
| Laser | 82.91 | 8.13 |
| Polishing | 83.20 | 8.14 |
9 Observations
As can be found from Table 9, the deviation in parameters among the manufacturing processes is minimal but attributes for a lot in the manufacture of the turbine blades. As the efficiency change is minimal which can even be estimated as a discrepancy in the taken boundary conditions and the assumptions, the blades can be manufactured using the most cost-effective method of extrusion which is also very reliable. In terms of large scale manufacturing where more than 10000 parts need to be manufactured, however, the extrusion process becomes redundant and forging might be a better means for the blades.
10 Conclusions and Further Work
A simple method for determining the effect of surface roughness of rotor and stator blades on the performance of the TwinGen mCHP project was determined. As observed in the CFX analysis the drop of efficiency after the application of the blade surface roughness was established. This result is in line and is consistent with various literature studies done previously.
In this thesis both the rotor and the stator blades were applied a roughness quotient, but since the rotors need to deliver more work and the stator need to be more sustainable as it takes a lot of heat from the combustion chamber, they can be affixed with different values of roughness and their individual efficiencies can be observed. The analysis uses certain design and setup assumptions as stated. These might give rise to minor discrepancies in the performance report such as the efficiency and power output calculations. However, these are negligible and can be ignored. There are some activities that will take place in the next phase of TwinGen project.
These activities include:
- Introducing a suitable air cooling system for the turbine stage
- Numerically examine the effects of the cooling system on thermal and aerodynamics performances.
11 References
| [1] | “World energy consumption,” , . [Online]. Available: http://en.wikipedia.org/wiki/World_energy_consumption. [Accessed 3 1 2018]. |
| [2] | “Micro combined heat and power,” , . [Online]. Available: http://en.wikipedia.org/wiki/Micro_combined_heat_and_power. [Accessed 2 1 2018]. |
| [3] | I. Genuth, “The Future of Things,” [Online]. Available: thefutureofthings.com/3063-engine-on-a-chip/. |
| [4] | “www.3dprint.com,” 3d Print, [Online]. Available: https://3dprint.com/193946/laser-sintering-vs-bulk-sintering/. |
| [5] | C. Rodgers, J. Watts, D. Thoren and K. &. B. R. Nichols, “Microturbines, Distributed Generation – The Power Paradigm for the New Millennium,” CRC Press LLC. USA, 2001, pp. cap. 5, pp. 120 – 148. |
| [6] | D. T. Nikolaidis, “Turbomatch”. |
| [7] | “Turbine blade,” , . [Online]. Available: http://en.wikipedia.org/wiki/Turbine_blade. [Accessed 2 1 2018]. |
| [8] | “Selective laser sintering,” , . [Online]. Available: http://en.wikipedia.org/wiki/Selective_laser_sintering. [Accessed 2 1 2018]. |
| [9] | “The Library of Manufacturing,” [Online]. Available: http://thelibraryofmanufacturing.com. |
| [10] | “Laser ablation,” , . [Online]. Available: http://en.wikipedia.org/wiki/Laser_ablation. [Accessed 2 1 2018]. |
| [11] | “Milling,” , . [Online]. Available: http://en.wikipedia.org/wiki/Milling_(machining). [Accessed 4 1 2018]. |
| [12] | “Surface roughness,” , . [Online]. Available: http://en.wikipedia.org/wiki/Surface_roughness. [Accessed 2 1 2018]. |
| [13] | C. G. Thomas Adams, “A Simple Algorithm to Relate Measured Surface Roughenss to Equivalent Sand-Grain Roughness,” International Journal of Mechanical Engineering and Mechatronics, vol. 1, no. 1, pp. 66-72, 2012. |
| [14] | “Engineering Toolbox,” [Online]. Available: www.engineeringtoolbox.com. |
| [15] | “Surface finishing,” , . [Online]. Available: http://en.wikipedia.org/wiki/Surface_finishing. [Accessed 2 1 2018]. |
| [16] | Sahehco, “ CC BY-SA 4.0,,” [Online]. Available: https://commons.wikimedia.org/w/index.php?curid=38443592. |
| [17] | D. Lurie, “GE Reports,” [Online]. Available: http://serkadis.com/v17/?author=4154. |
| [18] | Con-Struct, “Commons WIkimedia,” [Online]. Available: https://commons.wikimedia.org/wiki/File:World_energy_consumption.svg. |
| [19] | MTT, “Enertwin,” Enertwin, [Online]. Available: http://www.enertwin.com/enertwin-en/the-micro-turbine-technology. |
The table below shows the values obtained from SAMAD Power, done using Gasturb. The four cases are used to obtain a design space and run numerical calculations on the same.
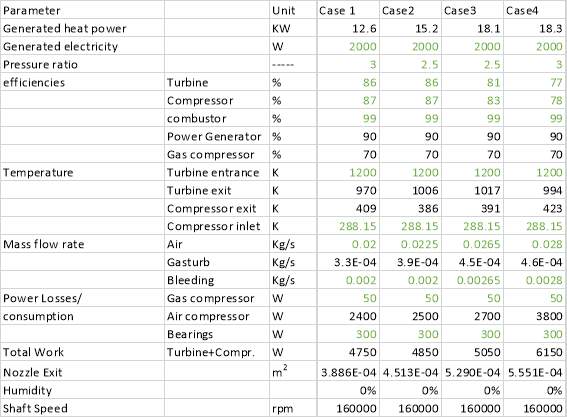
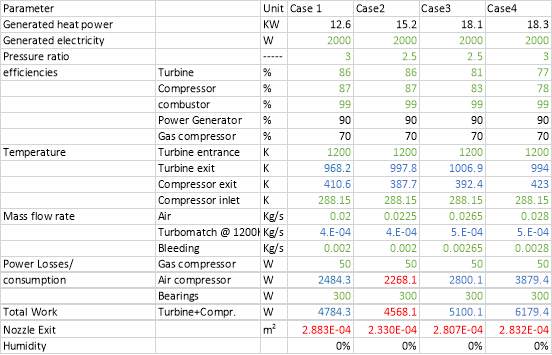
Figure 37: Turbomatch Parameters at 1200K TET
- Turbomatch Values @ 1150K TET
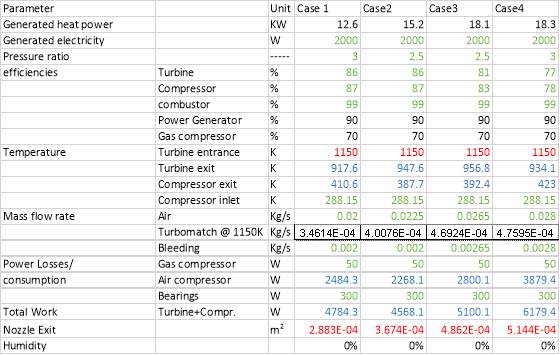
Figure 38: Turbomatch Parameters at 1150K TET
- Off Design Simulation Results
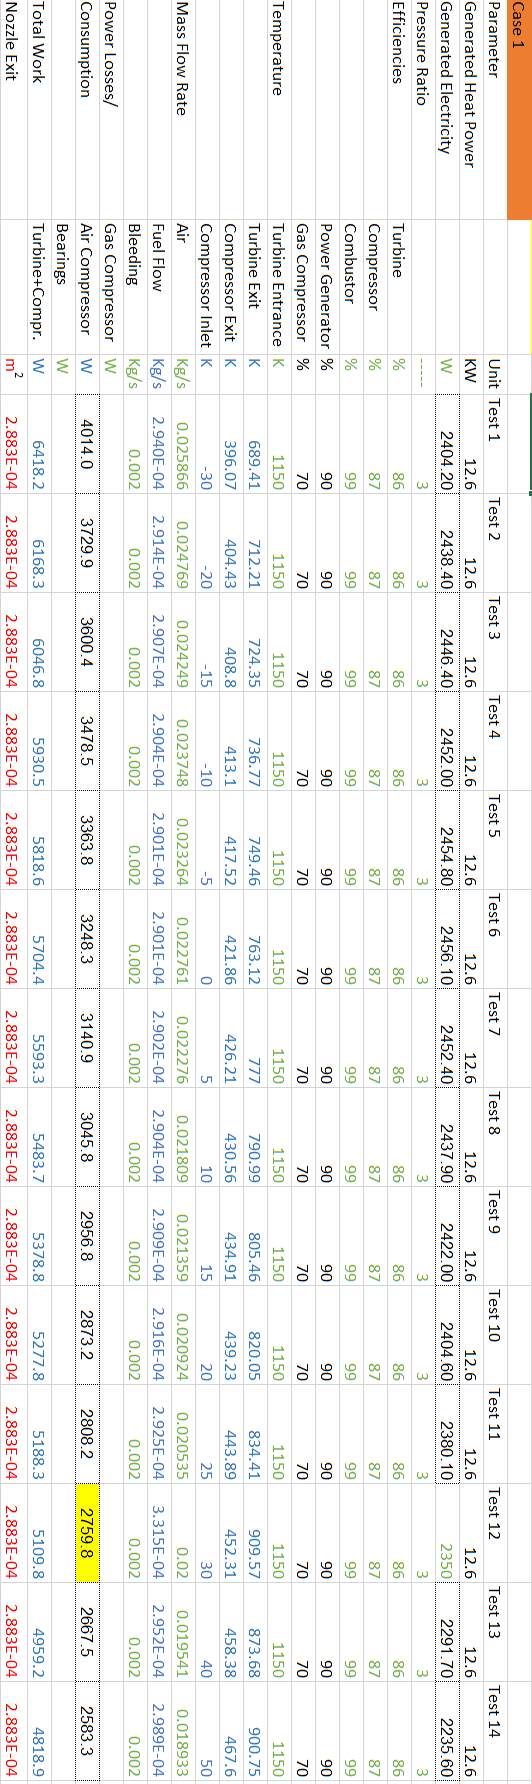
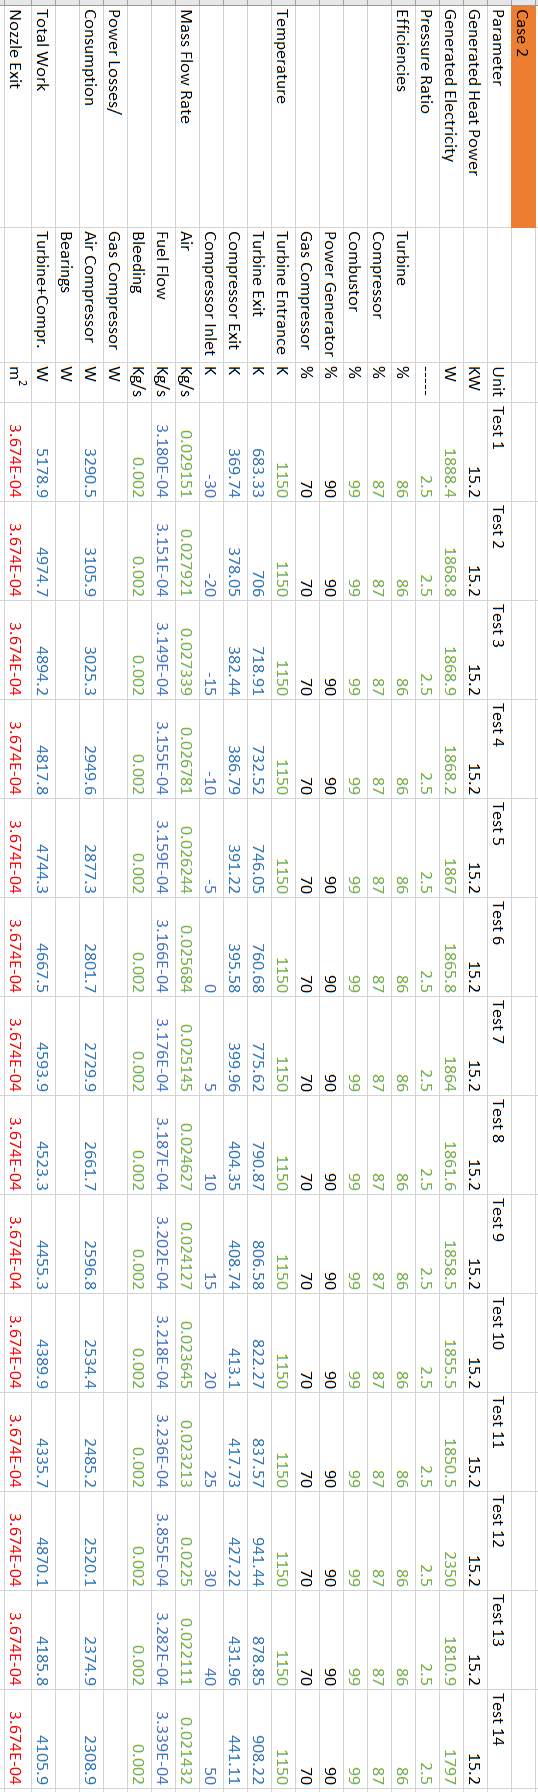

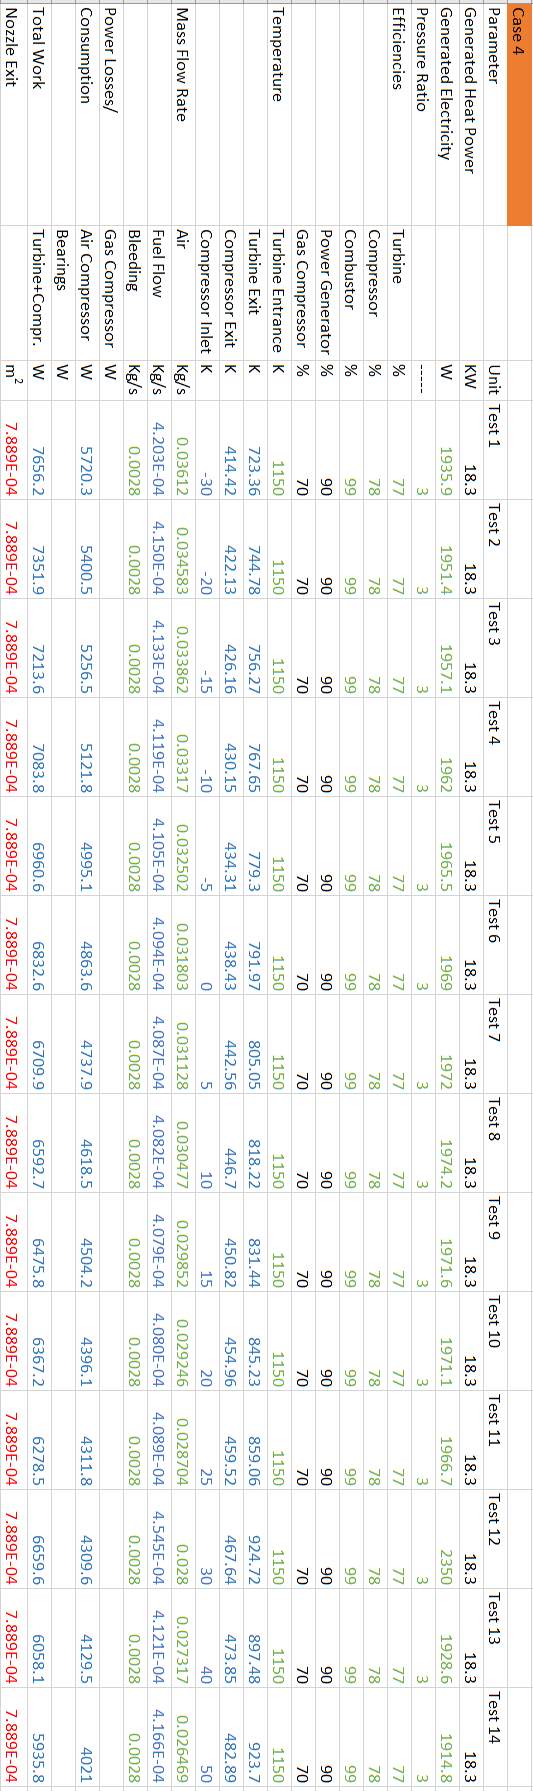
- Constant Power Output Simulation Results
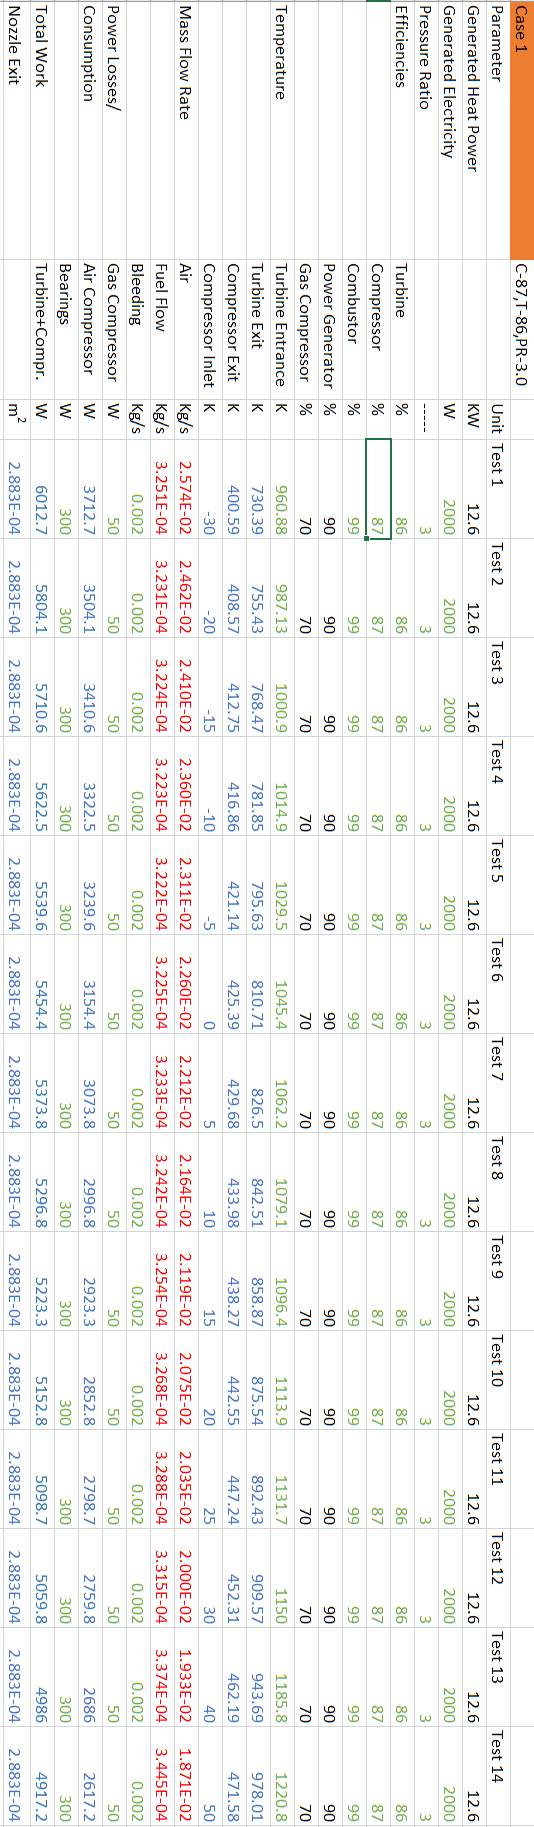
Figure 43: Constant Power Case-1
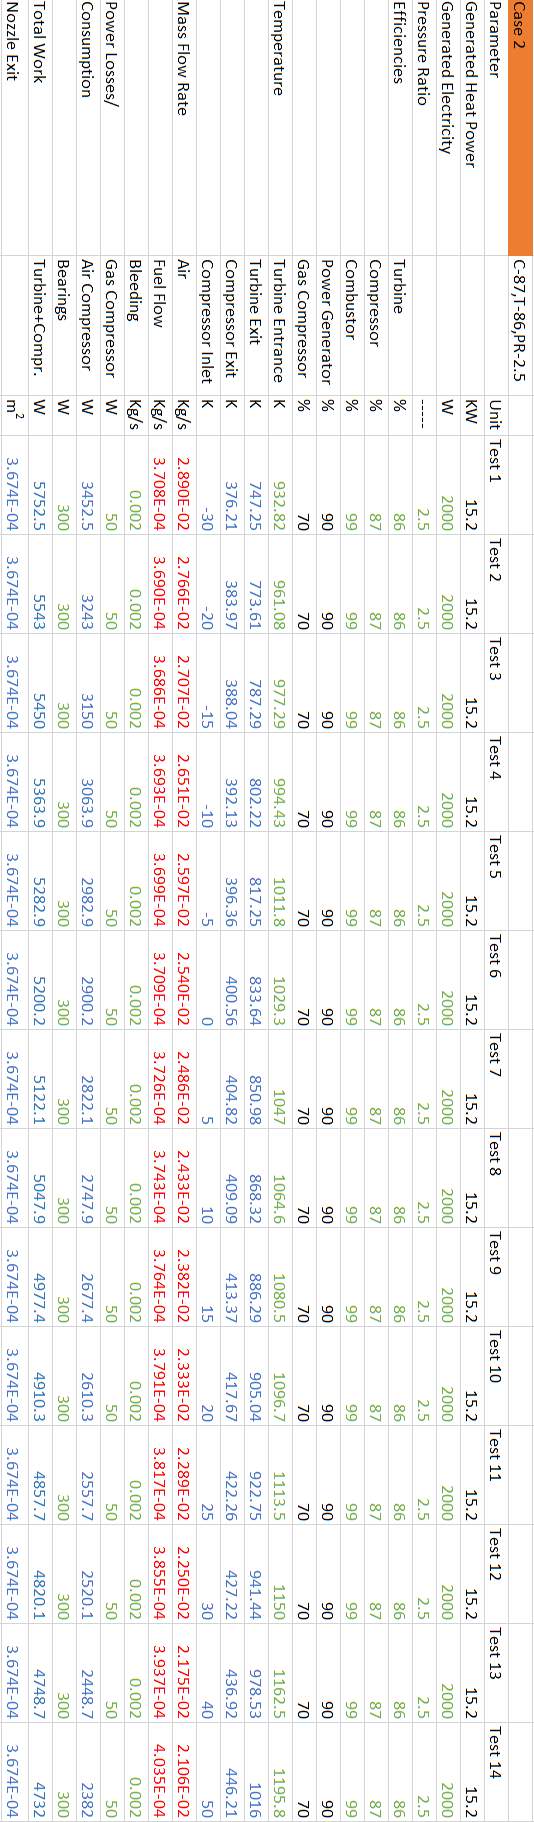
Figure 44: Constant Power Case-2
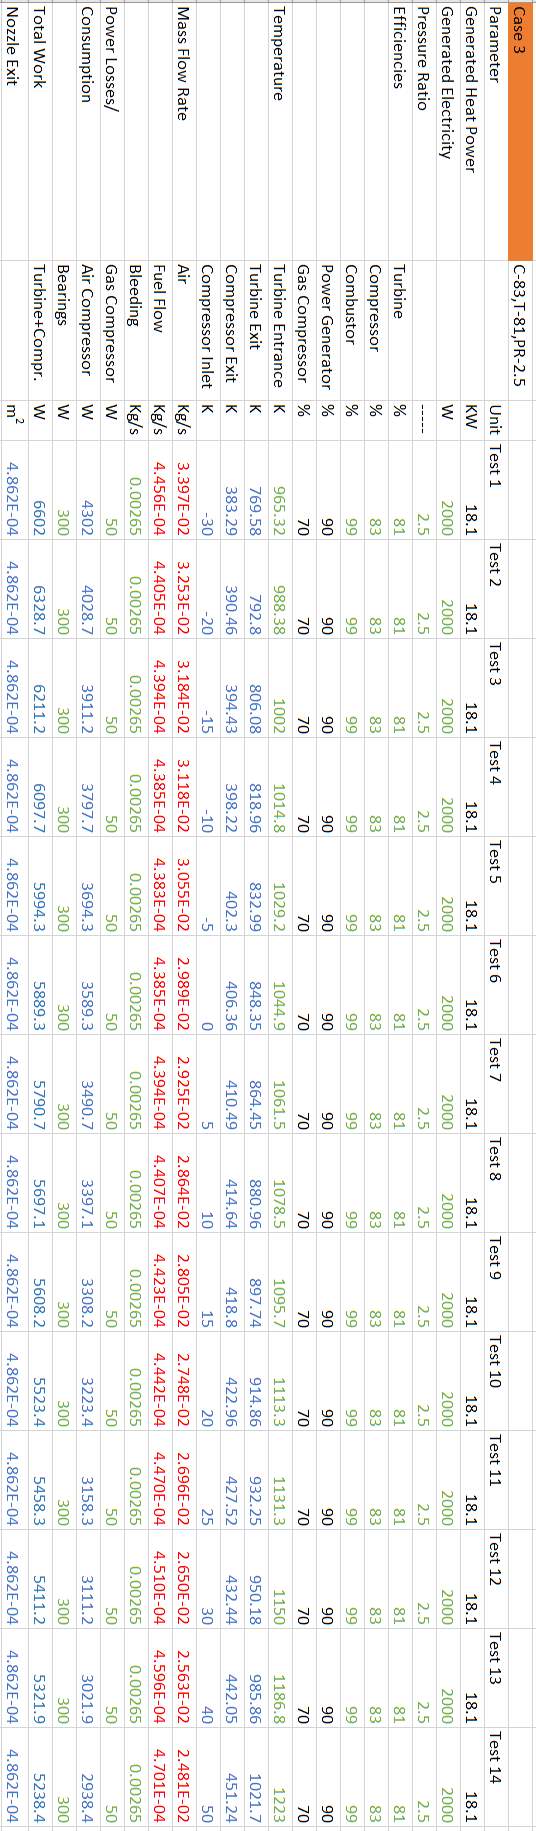
Figure 45: Constant Power Case-3
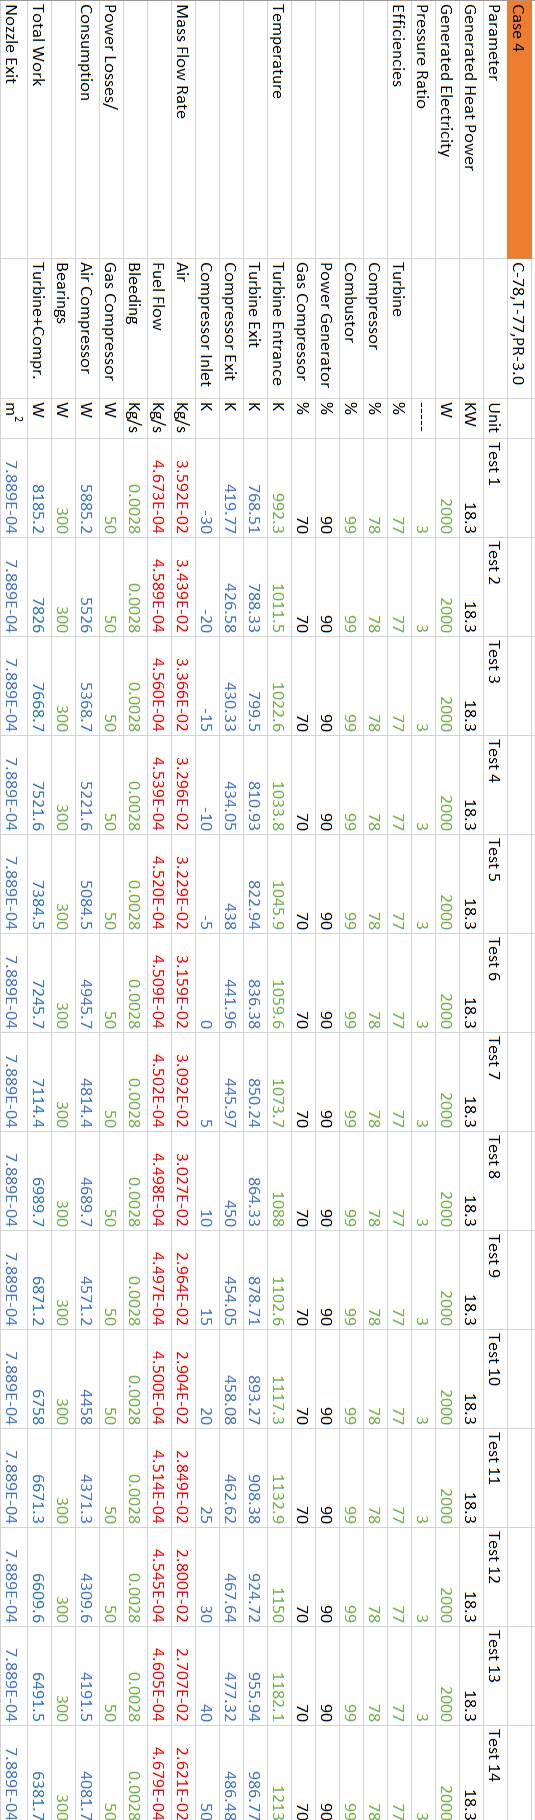
Figure 46: Constant Power Case-4
| Component | Case 2 | Case 3 | Case 4 | Case 5 | Case 6 |
| Inlet Duct | 104958 | 121836 | 167968 | 167968 | 167968 |
| Stator | 132192 | 231768 | 307488 | 389480 | 441432 |
| Rotor | 131016 | 352002 | 450956 | 564800 | 734756 |
| Outlet Duct | 31280 | 42350 | 60204 | 60204 | 60204 |
Cite This Work
To export a reference to this article please select a referencing stye below:
Related Services
View all


Related Content
All TagsContent relating to: "Electronics"
Electronics regards the science and technology involved in the development of electrical circuits and electronic devices and equipment that use them.
Related Articles

DMCA / Removal Request
If you are the original writer of this dissertation and no longer wish to have your work published on the UKDiss.com website then please: