Unmanned Aerial Vehicle Hardware and Software Differences
Info: 11625 words (47 pages) Dissertation
Published: 10th Dec 2019
Tagged: Computer ScienceAviation
There are different types of UAV shapes, mechanisms, configurations, and characteristics. Since UAVs have been developed for specific purposes, its hardware and software depend upon the specific tasks. The sections are system design, implementation, and software of a typical present-day UAV. The system design of a typical UAV includes the following: (1) frame structure, (2) Electro mechanics, (3) flight controller, (4) telemetry control system (Johnson, 2012).
1.1.1 Frame structure
The shape of the aircraft is called frame structure. Frame structure design is depending on the aircraft’s dynamic lifting method. For instance, rotary-wing aircraft (e.g., helicopter, quadcopter, etc.), which use spinning rotors with aero foil section blades to provide lift. (Johnson, 2012).
1.1.2 Electro mechanics
The components of the Electro mechanical of a typical UAV include: motors, propellers, speed controllers, and batteries, Different motor speeds and propellers provide different performance, example, the combination of high-speed motors and short propellers brings more agility and mobility for this aircraft, but lower efficiency and shorter battery life (Johnson, 2012).
1.1.3 Flight controller
Microprocessor on the aircraft is called flight controller, it controls the power output of each motor to maintain flight and return to operator orders. There are different control algorithms, such as servo thrust vectoring and variable pitch. Variable pitch algorithms apply the cyclic deferentially to non-coaxial propellers, it allows foragile control and the potential to rearrange independent electric motors with belt-driven props hooked to one central motor (Cutler and How 2012).
1.1.4 Telemetry control system
Telemetry control system is now commonly used in radio frequencies in various bands such as Wifi, FM. The primary general-use radio control systems in UAVs are single-channel analog equipment, which allowed for easy on-and-off switch control. Recently, systems have emerging the use pulse-code modulation (PCM) specifications to provide a computerized digital stream signal to the receiver, instead of analog-type pulse modulation (Johnson, 2012).
1.1.5 UAV control
Four UAV control problems have to be noticed in implementing UAV applications (Johnson, 2012).
- The number of UAVs to be used to achieve a task, were it may be single or multiple controllers.
- Whether the application is model-based or model-free: i.e., whether a mathematical dynamic model or control law for the UAV should be derived.
1.2 GCS SOFTWARE
UAV means the aircraft that remotely or autonomously controlled without a pilot. Ground control station (GCS) is designed to control the UAV from a remote distance. The mission and characteristics of the UAV is usually different from the manned aircraft; hence the design of the control station is differentiated. Due to distant control of UAV, the GCS displays must be designed to provide the enough level of situational awareness to the operators. It is preferred that all mission flights can be conducted automatically with a minimal amount of human intervention. Human operators act as just a manger, and ensure that the mission unfolds as planned (Yongjin Kwon1, 2016).
To develop the ground control station for unmanned systems, many factors have to be considered from the design stages, such as layout, information component, representation scheme, and human operation methods. Considering such many factors can be very difficult, hence we conducted an in-depth investigation of design factors from major UAV stations around the world. We analyzed the design characteristics and the specifics. Those include the screen display information, display method, number of screens, tactical situation information, operation of the tactical map equipment, number of operators, operator’s position, layout, and the operation environment. By doing so, we derive the common aspects of design characteristics, which lead to the successful design approach. Here is the list of seven major UAVs: MQ-TB Hunter, Scout, Search-er-II, Hermes 450, MQ-1 Predator, Avenger, and Global Hawk (Yongjin Kwon1, 2016).
1.3 IMAGE ORIENTATION
The quantitative analysis of UAV images is necessary to determine the geometry (e.g., size, shape, and position) of a target object. To accomplish this task, one must account for image distortions due to projective geometry and find their correct coordinates in object space. This is typically done by employing well-known collinearity equations, which provide rigorous mathematical relationships between the image points, object points, and camera position. Based on these equations, high-quality ground control points (with known coordinates in object space) must be given so that the camera’s position at the instant of exposure can be precisely determined. When two or more consecutive camera positions are obtained, the object coordinates for any image point existing in the overlapping region of the images can then be solved. Obtaining good approximated values for camera positions and orientations on a UAV platform at every instant of exposure is thus a challenging task. Additional efforts have been made to obtain appropriate initial values using the so-called direct linear transformation (DLT) technique (Kobayashi and Mori 1997). However, this alternative requires more ground control points and is sometime unstable due to singularity issues (Yongjin Kwonl, 2016).
The resulting quality of an absolute orientation approach is highly dependent on the quality and distribution of ground control points. Obtaining accurate ground control points requires careful ground surveys and is thus costly and even impossible for areas inaccessible to surveying operators. These limitations would give UAV images limited applicability in quantitative analyses. On the other hand, if one is only concerned with the relative geometry (i.e., size and shape) of a target object, a relative orientation approach could be applied. This approach does not require ground control points, but can still reconstruct relative positions and orientations between consecutive camera stations (Yongjin Kwonl, 2016).
1.4 APPLICATIONS ON CIVIL ENGINEERING
The horizontal nature of civil engineering lends to some practical and creative uses of UAVs in the industry. From planning to final construction, nearly every stage of the engineering process can benefit from the aerial craft. UAVs provide new opportunities for civil engineers, giving aerial views that are difficult to obtain using traditional civil engineering tools. Below, we summarize scenarios across various sub-disciplines in which UAV applications can yield great benefit. A UAV provides a flexible and economical mobile platform for acquiring spatial information on objects of interest. Compared with those obtained by traditional aerial or satellite platforms, UAV-acquired datasets have better resolution in both temporal and spatial aspects (Turner et al.2013). Furthermore, due to lower flight height and agile posture, a UAV is less affected by cloud shadows and is capable of collecting multi-view spatial datasets. Consequently, UAVs are regarded as an efficient platform for mapping and monitoring applications. For typical mapping tasks, their geometry and associated attributes should be identified and corrected first. Changes in them can then be further analyzed in a monitoring task when multiple observations across time are available. Applications of this kind are growing in number and are used in diverse fields (Javier Irizarry, 2014).
1.5 RESEARCH OBJECTIVES
It is envisioned that this feasibility study would ideally lead to further research on design, development, and field-testing of UAVs for applications identified as beneficial to the Department. It is also envisioned that this GDOT-based user-centered study for developing UAV design characteristics will provide a platform for appropriate data collection to facilitate FAA to accurately develop UAV integration policies, It is also important in analysis of image process and the mechanism of the GCS Software (Javier Irizarry, 2014).
2. LITERATURE REVIEW
Motivated by rapidly advancement of remote sensing and information technology, we explore the use of UAV based remote sensing and image processing technologies for the assessment of roads.
High resolution image data is essential in order to efficiently detect and measure features on roads for road condition monitoring. Aerial imagery can be a choice, but the limited maneuverability of the platform to acquire the image data and the associated high costs are shortcomings. In contrast, UAVs are highly flexible. UAVs can be programmed off-line and controlled in real time to navigate and to collect transportation data using a variety of multiple and interchangeable imaging devices and other sensors (NCRST,2003c). In addition, UAVs are able to operate rather close to the object, acquiring image with resolution as fine as a few centimeters (Eisenbeiss et al., 2005; UVS International, 2006; Zhang, 2009; Zhang and Elaksher, 2009). Examples of UAV-acquired high-resolution images show a pavement image captured with 3cm spatial resolution. Such image presents clearly pavement surface with fine structures in sufficient details which allows for identification and extraction of road condition parameters collected by our UAV. Even tire prints are clearly visible, demonstrating the capability and potential of such image for identification and measurement of the ruts. Furthermore, the UAVs today have many advantages over satellites and manned aircraft, such as collecting image data at a lower cost, faster and more safely. For this reason, UAVs have been employed in various research and applications, including precision agriculture/forestry (Herwitz, 2002; Xiangand Tian, 2007), surveillance (Kontitsis et al., 2004; Ameri et al., 2008), traffic management (Srinivasan et al., 2004; Coifman et al., 2004), and generation of geospatial products (Zhou and Li, 2006).
Innovative applications of UAS for improved mapping operations take advantage of several inherent characteristics of UAV systems. For instance, aerial video, collected by visible or infrared video cameras deployed on UAV platforms, is rapidly emerging as a low cost, widely used source of imagery for response to time-critical disaster applications (Wu and Zhou 2006) or for the purpose of fire surveillance (Wu et al. 2007). During the past decade, UASs have been applied in a wide range of transportation areas, including monitoring and controlling traffic on surface streets during and after emergency incidents, traffic data collection, monitoring bridges and overpasses during severe weather or general maintenance, day-to-day monitoring of roadways for preventative maintenance activities, and managing work zone and traffic congestion while enhancing the safety of workers. UAS applications in traffic management, transportation and construction disciplines related to DOTs (Zhou and Li, 2006).
The assessment of road surface distress is an essential part of a road management system for developing repair and maintenance strategies to ensure a good and an effective road network. Over the last decades, significant progress has been made and new approaches have been proposed for efficient collection of pavement condition data, an innovative UAV-based digital imaging system for aerial assessment of surface condition data over rural roads. The system for unpaved road image acquisition consists of a UAV helicopter equipped with a digital camera, a GPS receiver, a ground control station, an Inertial Navigation System (INS), and a geomagnetic sensor. The UAV features an electric engine with a payload of 15 lbs (6.8 kg) and is capable of flying around 25 minutes with a fully charged battery. It can reach 650 ft (approx. 200 m) above the ground and travel at a maximum speed of 30 ft (approx.10 m) per second (Elaksher, 2012).
Several other studies also suggest the usefulness of UAS in the traffic management to handle traffic and congestion on the main road network such as moving vehicle detection (Lin et al. 2008), autonomous ground vehicle following and providing local and “over- the-horizon” visual coverage, visualization and parameter estimation of 15 traffic flows and real-time video relay for traffic monitoring system, These applications are performed through a UAV that is equipped with a camera (Chen et al., 2007).
3. PAVEMENT MANAGEMENT
A Pavement Management System is a procedure for analyzing, maintaining, and reporting pavement data, to direct the decision makers in finding optimum ideas for maintaining pavements in serviceable condition over a given period of time for the least cost (Eaton and Beaucham, 1992).
A newly constructed or well-maintained road should have excellent surface condition and provides smooth and safety traffic. However, the roads can be deteriorated very quickly due to traffic, weather, bad habit of driving etc. Excessive use of roads and heavy traffic during planting in spring and summer and harvest in fall damage roads more quickly and frequently. The uneven thaw pattern results in water trapped between different layers of road. Typical distresses during this thaw state include severe ruts and large potholes. These damaged roads, if not promptly repaired, tend to be degraded more quickly with severe weather and traffic. In general, distresses on roads create difficulty to local community in day-to-day commune, transport of goods, and seasonal farming practice. In addition, the deteriorated roads pose a major challenge in traffic safety (Eaton and Beaucham, 1992).
3.1 Pavement work on road condition assessment:
Road management system is important to state DOTs and local transportation authorities. An important component of such management system is surface condition survey and rating procedures. The predominant method in conducting road condition survey and analysis is still largely based on extensive field observation by experts. This method is slow, expensive, prone to error and poses safety problems (Eisenbeiss et al., 2005).
Gravel PASER Manual (2002) suggests focus on major factors as well as detailed surface conditions. These include Crown, Drainage, Gravel layer, Surface deformation and Surface defects. Similarly, In Unsurfaced Road Maintenance Management, road condition is determined through Unsurfaced Road Condition Index (URCI), a numerical indicator based on a scale of 0 to 100. URCI indicates the roads integrity and surface operational condition. URCI is determined by measuring seven surface distresses, including improper cross section, inadequate road side drainage, corrugations, dust, potholes, ruts, loose aggregate. The detailed definition of severity of each distress and approach to the measurements are given in the both documents. State DOTs also provide guidelines of identification of distress and determination of severity. While little attention has been paid on the advancement of unpaved road evaluation approach, research of pavement assessment has been very active in transportation agencies and research community. The technologies developed in pavement evaluation may provide some hints and incentives. Some may be adaptable to unpaved road maintenance with modifications and 13 improvements. Recent efforts on pavement condition assessment are to develop pavement survey vehicle coupled with sensor technologies and data-processing onboard (Eisenbeiss et al., 2005).
3.2 UAV-based Road Condition Evaluation
Motivated by rapidly advancement of remote sensing and information technology, we explore the use of UAV based remote sensing and image processing technologies for the assessment of roads, our developed UAV-based remote sensing system acquires road imagery with high resolution from an UAV helicopter, and assesses roads based on the condition parameters derived through the development of sophisticated algorithms for image processing and analysis. In contrast to convention ground survey, this new approach performs distress measurement from UAV acquired imagery, therefore, improving the evaluation accuracy and reliability. This approach is faster, safer, and more consistent. In addition, the acquired imagery and developed algorithms may also be useful for the extraction and measurement of other road properties, such as road way width, curvatures, etc. which are also important components in road way management (Eisenbeiss et al., 2005).
3.3 Mechanism of UAV survey using GCS for pavement management
As discussed in previous chapter, high resolution image data is essential to efficiently detect and measure features on roads for road condition monitoring. Aerial imagery can be a choice, but the limited maneuverability of the platform to acquire the image data and the associated high costs are shortcomings. In contrast, UAVs are highly flexible. UAVs can be programmed off-line and controlled in real time to navigate and to collect transportation data using a variety of multiple and interchangeable imaging devices and other sensors (NCRST, 2003).
UAVs are highly flexible source for remote sensing data., it can be programmed off-line and controlled in real time to navigate and to collect data, this are able to operate rather close to the object, acquiring image with resolution as fine as a few centimeters, it also has other advantages over satellites and manned aircraft, such as collecting image data at a lower cost, faster and more safely. In addition, UAVs are able to operate rather close to the object, acquiring image with resolution as fine as a few centimeters (Zhang and Elaksher, 2009).
3.4 UAV MAPPING SYSTEM
The following are the objectives used in UAV Mapping system (Ahmed F. Elaksher, 2010).
- The helicopter: weights 15lb, can reach 200m, maximum speed of 10m per second.
- GPS receiver: provides the 3D coordinates
- Information Inertial Navigation System: provides the orientation and velocity of the UAV.
- Autopilot board: acquires GPS & inertial navigation system data, and control the flight & camera. The Autopilot board can be controlled with manual remote control and can be engaged/disengaged upon the command.
- Camera: Canon EOS Digital Rebel XTi digital camera, f=50mm, 3888x2592pixels, pixel size of 5.7µm
- Ground Control: The weGCS software is installed on the GCS computer. The software features an interface for mission planning allowing for setting of mission parameters.
3.4.1 The helicopter
The helicopter shown in below Figure features an electric engine. It has a payload of 15lb, and can fly around 25 minutes with fully charged battery. This mini UAV can reach 200m above the ground and travel at a maximum speed of 10m per second.
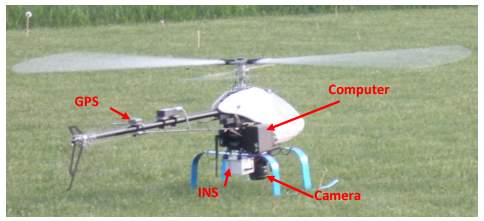
Figure 3.1: UAV Wolverine Electric Helicopter (Ahmed F. Elaksher, 2010).
3.4.2 GPS receiver
A GPS navigation device, GPS receiver, or simply GPS is a device that can receive information from GPS satellites and then to calculate the device’s geographical position. Using suitable software, the device may display the position on a map, and it may offer directions (Ahmed F. Elaksher, 2010).
3.4.3 Information inertial navigation system
A way to calculate position based on an initial GPS reading followed by readings from motion and speed sensors using dead reckoning. Useful when GPS is not available or has temporarily lost its signal, INS provides a means of accurately collecting mapping data from a UAV, and is essential for utilizing advanced sensors.it also provides the orientation and velocity of the UAV (Ahmed F. Elaksher, 2010).
3.4.4 Autopilot board
An autopilot is a system used to control the trajectory of an aircraft without constant ‘hands-on’ control by a human operator being required. Autopilots do not replace human operators but assist them in controlling aircraft, allowing them to focus on broader aspects of operations such as monitoring the trajectory, weather and systems (Ahmed F. Elaksher, 2010).
Our work focusses on acquiring imagery using a UAV and extracting information from the image data. The conceptual approach is presented in below Figure. In addition to the operation of UAV for road image collection, the research includes development of the processing methods for accurate positioning and measurement from imagery, automated extraction of accurate digital surface model, and generation of high resolution orthoimages, and measurement of distresses. The measured parameters facilitate derivation of information about road quality to enable advanced warning of road deterioration. System tests are conducted, and the performance of system is compared with detailed ground survey to determine the measurement quality (Ahmed F. Elaksher, 2010).
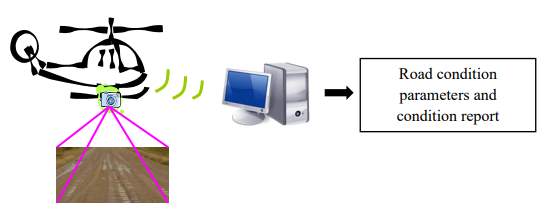
Figure 3.2: Conceptual approach of UAV-based unpaved road condition (Ahmed F. Elaksher, 2010).
4. IMAGE ANALYSIS
4.1 Reviews on Automated Image Collection Technology
Various sensors have been used for Automated Image Collection Systems, The senor types of the AICS’s fall into five categories: photographing, videotaping, digitizing through visual ray area scan camera, digitizing through visual ray line scan camera. The PASCO Road recon system is the first AICS used to capture pavement images. This system consists of a 35-mm camera mounted on cantilever structure at the top of a bus and produces a continuous filmstrip recording of the pavement surface. The images are taken at night with an artificial light system to control its illumination condition. The vehicle can be operated at speeds up to 50 mph and an image covers an area of 16 ft in width and 50 ft in length. Manual interpretation of the images is required to evaluate pavement distress (McGhee K. H, 2004).
Researchers at the University of Texas at Austin developed an AICS system called TxDOT Pavement Survey Vehicle. The system consists of a high-speed frame grabber, computer, a digital line scan camera and image analysis software called “VCrack” [7]. The system could work at speeds up to 70mph and records images of 2048 x 512 pixels covering an area of 10 feet in width by 3 feet in length on pavement. The system first used natural lighting and later adopted LED linear lighting unit for consistent illumination and operation at night time. This system is able to classify longitudinal crack, transversal crack, block and alligator cracks for asphalt pavement and longitudinal crack, transversal crack and punch outs for concrete pavement (McGhee K. H, 2004).
4.2 Reviews on Automated Image Analysis Technology
Due to rough surface and non-uniform illumination of the pavement image, pavement images have a significant amount of background noises. Neighborhood averaging and median filtering are commonly applied as methods of image enhancement. Segmentation is a process of partitioning a digital image into multiple segments (sets of pixels, also known as super-pixels). Thresholding is the most commonly used technique in image segmentation (McGhee K. H, 2004).
The thresholding method based on statistical parameters of the images to detect cracks on pavement images. A set of sample images including linear cracks and alligator cracks were used to test their developed method. Experimental results show that their method could process the pavement images in real time and reduce the negative effects caused by variation of pavement reflection rates (Chan et al., 2003).
The novel automatic crack detection approach based on segment extending for complex pavement images. By analyzing the relationship between connected domains, interrelated segments is connected to form a crack and the character of crack direction could be better used in crack recognition, and the results show that the surface crack could be identified correctly and automatically (Liu et al., 2003).
4.3 Image analysis procedure
After collecting multiple pavement images from GCS using UAV controller (Xinren Yu, 2011).
- Different image analysis techniques are developed for detecting potholes,
- A three-layer feedforward neural network is proposed for distress classification. Distress explained in the previous chapter can be classified into different types of cracks (transversal, longitudinal) or potholes with various severity levels (low, moderate, or high).
- A pavement distress segmentation method based on Genetic Algorithm is proposed. Detailed design and implementation of the algorithm is discussed.
- Simulation results of the above algorithms are given illustrating the Effectiveness of the proposed systems, using MATLAB R2008b.
4.3.1 Image analysis techniques for pothole detection
The main aim of the proposed image processing module is to extract laser color regions in the image. After extracting the laser line from the background, the resulting section describes different image processing techniques for detecting potholes. The image database considered in this chapter is composed of grayscale images acquired during a pavement surface visual survey over a local road in Toledo, Ohio. A UAV controller with its optical axis perpendicular to the road surface, at a certain vertical distance about 1.5 m from the pavement surface and a digital camera was used to capture the image (Koch C, 2010).
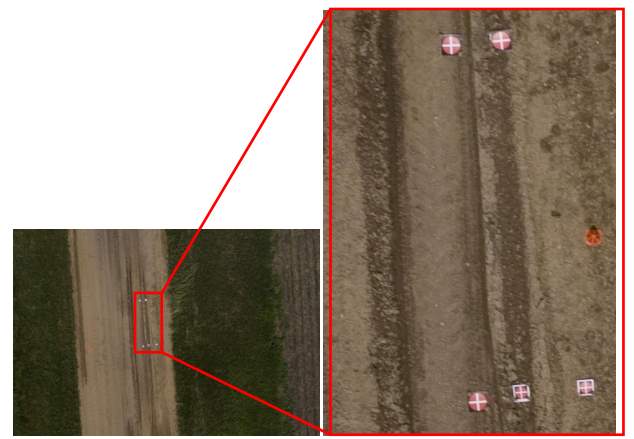
Figure 4.1 Image taken from UAV indicate pothole of the road (Xinren Yu, 2011).
4.3.2 Enhancement of UAV Images
The removal of impulse noise is an important issue in pothole detection. After the video sequences are captured as image frames, the frames are scanned to detect the laser line. The laser line is affected by the superposition of a certain amount of undesired external lighting. An enhanced median filter is applied in the initial step to perform noise reduction in an image. The standard median (MED) filter is a well-known nonlinear filter that eliminates the noise and performs well in the smooth region of an image. It considers each pixel in the image in turn and looks at its nearby neighbors to decide whether or not it is representative of its surroundings. Instead of simply replacing the pixel value with the mean of neighboring pixel values, it replaces it with the median of those values. The median is calculated by first sorting all the pixel values from the surrounding neighborhood into numerical order and then replacing the pixel (Liu Y, 2010).
Considered with the middle pixel value. If the neighborhood under consideration contains an even number of pixels, the average of the two middle pixel values is used. However, when noise level increases or the edges in the image are thin, the median filter may not work well. In order to improve the performance of the median filtering, a multi-stage median filter which uses 4 directional median values a represented by masks in Figure 4.2 is considered (Liu Y, 2010).
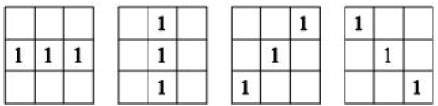
Figure 4.2 Four masks used for filtering (Liu Y, 2010).
The multi-stage median filter could be used to reduce the noise while preserving much of the detail in the image and produce better results compared to the standard median filter due to its multi-window architecture (Liu Y, 2010).
4.3.3 Thresholding based on Global Information
Thresholding is a widely used technique for image segmentation and feature extraction. In many applications of image processing, the gray levels of pixels belonging to the object are substantially different from the pixels belonging to the background. During the thresholding process, individual pixels in an image are marked as “object” pixels if their value is greater than some threshold value and as “background” pixels if they are lower. In this paper, a laser line pixel is given a value of “0” while a background pixel is given a value of “1”. Finally, a binary output image is created, as shown in Figure 4.3 (Xinren Yu, 2011).
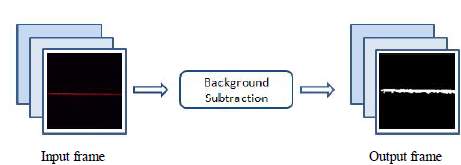
Figure 4.3 Image thresholding (Background Subtraction) (Xinren Yu, 2011).
4.3.4 The Otsu’s Method
Due to the strong concentration of the laser source, noise such as shadow, lane marks, oil stains etc. will barely influence the thresholding results. A simple global segmentation method will be practical for this type of application. Here we used a common thresholding algorithm known as Otsu’s method for automatic thresholding. n computer vision and image processing, Otsu’s method is used to automatically perform histogram shape-based image thresholding, or the reduction of a gray level image to a binary image. The algorithm assumes that the image to be thresholder contains two classes of pixels (e.g. foreground and background) then calculates the optimum threshold separating those two classes so that their combined spread (within-class variance) is minimal (Koch C, 2010).
In Otsu’s method we exhaustively search for the threshold that minimizes the within-class variance, defined as a weighted sum of variances of the two classes (Koch C, 2010).
σω2t= ω2tσω2t+ω2(t)σω2(t) Equation (4.1)
where weights ω1 are the probabilities of the two classes separated by a threshold t and σ1 variances of these classes. Otsu shows that minimizing the within-class variance is the same as maximizing between-class variance (Koch C, 2010).
σb2t= σ2- σω 2t= ω2(t)ω2(t)[μ2t- μ2t]2 Equation (4.2)
which is expressed in terms of class probabilities ω1 and class means μ 1 which in turn can be updated iteratively. This idea yields an effective algorithm as shown below (Koch C, 2010).
- Compute histogram and probabilities of each intensity level
- Set up initial ω1(0) and μ1(0)
- Step through all possible thresholds t=1……maximum intensity
Update ω1 and μ1, Compute σ1 (t)
- Desired threshold corresponds to the maximum σ1 (t)
Otsu’s method which is based on the statistics of gray level histograms is a well-accepted method for image thresholding. The process leads to a lower threshold value which would effectively reduce the misclassification caused by low gray value noises. After an appropriate threshold value is determined, the pixels with gray level below the threshold are classified as distress pixels and pixels with gray level value exceeding the threshold are assigned to the background. Figure 4.4 shows the binary image obtained from the Otsu’s segmentation algorithm (Koch C, 2010).
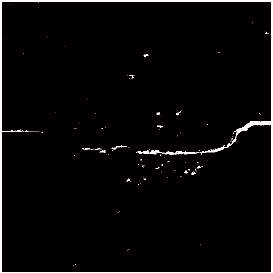
Figure 4.4 Binary image obtained from the Otsu’s segmentation algorithm (Xinren Yu, 2011).
Based on the number of pixels in a connected component, any connected components less than a pre-defined value would be considered as noise and removed from the image. An original binary image after thresholding is shown in Figure 4.5. The discontinuities of the line are filled after applying closing operation, as shown in Figure 4.6. The noise points are removed after using the connected component method, as shown in Figure 4.7.
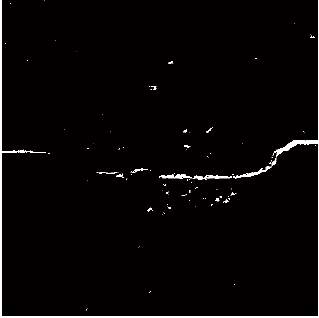
Figure 4.5 Original binary images after thresholding (Xinren Yu, 2011).
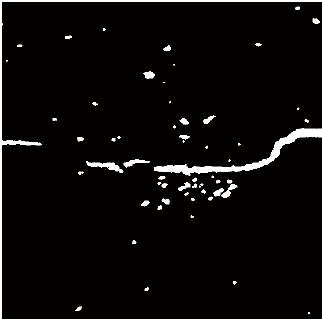
Figure 4.6 Binary images after closing (Xinren Yu, 2011).
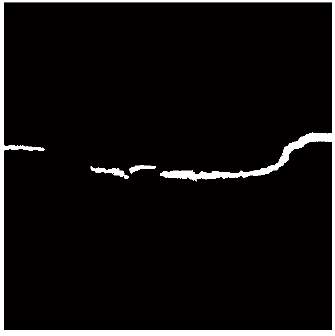
Figure 4.7 Binary images after removing noise (Xinren Yu, 2011).
4.3.5 Pothole Shape Estimation
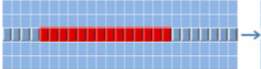
After the tile partitioning step, each frame is compared with the template frame, tile by tile, for any deformation. A simple mechanism is introduced to distinguish the deformation of the laser line caused by an obstacle rather than a pothole. The number of tiles in each row that differ between the input frame and the template frame are calculated. If the row that has the maximum deformation of 1’s is above the row that has the maximum deformation of 0’s, the laser line would be intersecting an obstacle in the scene. Otherwise, we determine this row to be an actual deformed tile row due to a pothole. The row is stored in a new matrix as the first row. This matching process will continue until no further deformation is detected. All rows that qualify for deformation are stored in the new matrix. The output matrix would be an estimated shape of the pothole. (Koch C, 2010). The process is shown in Figure 4.8
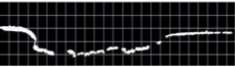
- A typical road surface scan Image
- Deformation tiles detected from the Scan. (c) Deformation rows accumulated
The row with maximum deformation frame by frame the estimated
Is sorted in a new matrix shape of the pothole is generated.
Figure 4.8 Template matching method for pothole shape estimation (Xinren Yu, 2011).
4.4 Pavement Distress Classification Using Neural Network
Distress extracted through the process as explained in the previous section can be classified into different types of cracks (transversal, longitudinal) or potholes with various severity levels (low, moderate, or high). In this chapter, a three-layer feed-forward neural network is used for distress classification (Koch C, 2010).
4.4.1 Architecture of the Neural Network
This system is developed to determine crack types and pothole severity levels using a spatial neural network concept. As shown in Flow chart 4-1, system architecture consists of three processes: (1) artificial training data generation, (2) distress tile generation, and (3) crack type and pothole severity level classification (Koch C, 2010).
Tile Image Generation
Data Generation


Training Data

NN Training


Pothole severity level and crack type
Distress Tile data


Distress Classification Result
Figure 4.9 System architecture of the neural network (Xinren Yu, 2011).
4.4.2 Data Generation
In order to validate the classification system, real pavement images are needed to train the artificial neural network. However, a database that includes all different types of cracks and potholes would be difficult to obtain. Therefore, a computer program was developed to generate an artificial set of training data. Two hundred images that cover longitudinal cracks, transverse cracks, different pothole extents and severity levels were generated (W Gong, 2005).
4.4.3 Neural network Training
The neural network is trained with the computer-generated data using the back-propagation procedure. The MSE (mean square error) shown in Equation (4.4) was used to measure the performance of the neural network.
MSE =
12 ∑Tpk(Tpk-Opk)2 Equation (4.4)
Where
Tpkis the desired target output,
Opkis the actual output, k is a output unit, and p is the particular training data, respectively. The outputs of the neural network are computed through the feed-forward procedure, and connection weights are updated by the back-propagation procedure. After the training process is completed, the performance is tested by using real distress data through the classification process (W Gong, 2005).
4.4.4 Pothole Severity Level and Crack Type Classification
The pothole severity levels (low, moderate, or high) and the crack type (Longitudinal or transverse) of actual pavement images is determined using a specific neural network which is trained using artificial images. There are two groups of inputs in this process: the saved connection weights of the neural network and the actual pavement tile images. After the training process, the connection weights of the neural network are generated. (W Gong, 2005).
The distress measure in an image is calculated by accumulating the differences between adjacent histogram values. The neural network distinguishes the distress type by finding the unique pattern of uniformity in these distress values. Histograms are used to measure the statistical information by counting the number of distress tiles (zeros) in each column, row and the whole matrix (W Gong, 2005).
The vertical distress measure is determined by accumulating the differences between the numbers of deformed tiles in adjacent columns using below Equation (4.5) (W Gong, 2005).
VDi=∑i=1Nc=1∣Hvi+1-Hhi∣ i=1…Nc Equation (4.5)
Where VD is the vertical distress measure, Hv is the vertical histogram, and Nc is the number of columns, respectively (W Gong, 2005).
Similarly, the horizontal distress measure is computed by accumulating the differences between the numbers of deformation tiles for adjacent image rows using below Equation (4.6) (W Gong, 2005).
HD[i] =
∑i=1Nr=1∣Hhi+1-Hh[i]∣ i=1….Nr Equation (4.6)
Where HD is the horizontal distress measure, Hh is the horizontal histogram, and Nr is the number of rows, respectively (W Gong, 2005).
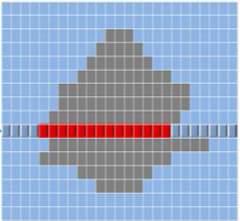
For example, below Figure 4.9, the vertical distress is 18. The horizontal distress is 30 and the total number of distress tiles is represented by the total number of zero tiles in the image, which is 86 (W Gong, 2005).
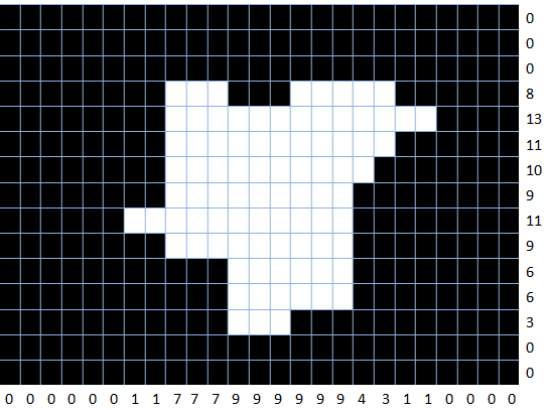
Figure 4.10 Distress tiles distribution (W Gong, 2005).
If the distress is of a transversal crack type, the vertical distress measure should have a low value, which indicates that there is little deviation between any of the columns for this image. If the distress is of the longitudinal type crack, the horizontal 40 distress measure should have a low value, which indicates that there is little deviation between any of the rows for this image. If both distresses measures have a large value, the distress is classified as a pothole, which indicates the deviation is significant in both directions. Following this step, based on the total number of distress tiles computed from the segmented image matrix and the depth index from the previous steps, we are able to classify the distress into different types of cracks or potholes with different degree of severity levels (W Gong, 2005).
The crack type and severity level of the pothole is classified according to the data shown in Table 4.1. Using this table, the distress in Figure 6 is classified as a pothole with a moderate level (Xinren Yu, 2011).
Table 4.1 Distress classification guideline A (Xinren Yu, 2011).
| Vertical Distress
Measure |
Horizontal Distress
Measure |
Total No. of Distress tiles | Depth
Index |
|
| Low | >5 | >5 | <40 | 1 |
| Moderate | >5 | >5 | 40-120 | 2 |
| High | >5 | >5 | >120 | 3 |
| Transverse | <2 | >5 | <40 | 1-3 |
| Longitudinal | >5 | <2 | <40 | 1-3 |
4.5 Genetic Algorithms Used for Pavement Distress Detection
Holland [26], who was inspired by the theory of evolution, proposed Genetic Algorithms in the early 1970s. Genetic Algorithms have been applied successfully to a large number of problems in automatic design, pattern recognition, robotic control, and even music generation. The gradual adaptation process of natural chromosomes has occurred primarily to produce a fittest individual who can survive in an ever changing environment. This process in natural genetics is artificially simulated in Genetic Algorithms to find the optimum solution to an optimization problem. Genetic Algorithms apply some of natural evolution mechanisms such as crossover, mutation, and survival of the fittest to optimization and machine learning. Genetic Algorithms provide an efficient search method working on population and have been applied to many problems of optimization and classification. In the conventional Genetic Algorithms, each solution is presented by fixed length string (T Liau, 1996).
A general Genetic Algorithms process consists of the following steps: (1) Initialize the population of chromosomes, (2) Calculate the fitness for each individual in the population, (3) Reproduce the individuals selected to form a new population according to each individual’s fitness, (4) Perform crossover and mutation on the population, (5) Repeat Steps (2) through (4) until some condition is satisfied (T Liau, 1996).
The reproduction operator is an artificial version of natural selection. Individual chromosomes are selected according to their fitness, which is evaluated by using an objective function. The result of reproduction means that each individual chromosome with a higher fitness value will have a higher probability to contribute one or more chromosomes in the next generation (T Liau, 1996).
Crossover operation swaps some part of genetic bit string within parents. It emulates just as crossover of genes (chromosomes) in real world that descendants have inherited characteristics from both parents. There are two simple ways in terms of the number of crossover points that are used to crossover operation: single-point and two-point crossover. Figure 4.10 shows an example of one-point crossover. Two strings Parent Chromosome 1 (PC1) and Parent Chromosome 2 (PC2) are chosen from the population. All the characters of PC1 and PC2 after the fourth bit are swapped and two offspring chromosome are created (T Liau, 1996).
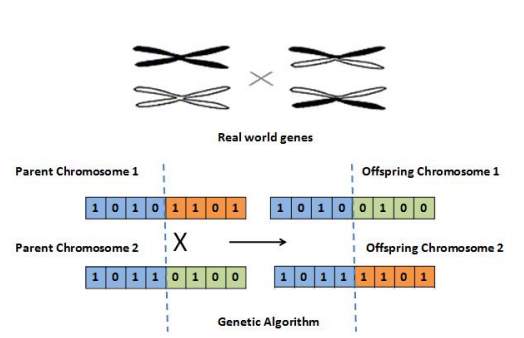
Figure 4.11 Crossover operations (T Liau, 1996).
Mutation operation inverts some bits from the whole bit string at very low rate. In real world we can see that some mutants come out. Figure 5-2 shows mutation operation to Genetic Algorithms. The character of the parent chromosome at the second bit is chosen and its value is altered (0 to 1).
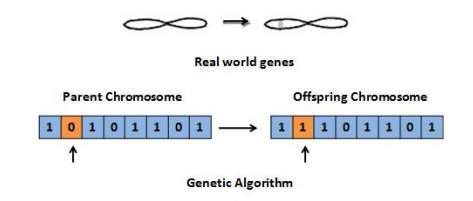
Figure 4.12 Mutation operation of one bit (T Liau, 1996).
4.5.1 Genetic Algorithm for Pavement Distress Extraction
The proposed Genetic Algorithm is used in segmentation of the pavement distress image. The input is a grayscale image taken from the pavement surface that contains the distress and the background. The output is the best threshold value for segmentation. Our segmentation algorithm can be described by specifying the encoding, fitness function, selection, and crossover and mutation operations. To run the algorithm, the population of individuals is set to be 10, and the evolution process is performed iteratively one generation at a time. In the end, the individual with the highest fitness is decoded to be the threshold for the segmentation (T Liau, 1996).
4.5.2 Encoding
We take a string of 0’s and 1’s like a classical GA for the encoding operation. The generated string is called a chromosome. We define the size of the chromosome to be 8 bits in our case. Each chromosome represents a threshold value from 0 to 256. For example the chromosome for 24 would be 00011000 (T Liau, 1996).
4.5.3 Fitness Function
New maximum entropy principle for image thresholding. In their method, a criterion function by applying information theory is defined and used to choose the optimal threshold value (J. N. Kapur et al, 2010).
4.5.4 Selection
Selection is a process which mimics the natural survival of the fittest creatures. Each string has a fitness value obtained by evaluating the fitness function. The probability of each string to be selected is proportional to its fitness value. In this thesis, the tournament selection procedure is performed as follows: two strings C1 and C2 are randomly selected from all possible threshold values and its fitness value is calculated. The string with the best fitness value is chosen to belong to the mating pool. This procedure is repeated, until filling a mating pool of the population P (T Liau, 1996).
4.5.5 Crossover
The crossover operator works by randomly selecting two strings C1 and C2 of the current population. In our implementation, single crossover is applied, and as follows: a random integer number q within [0, 7] called the crossover point is generated. Two offspring strings are created by swapping all the characters of C1 and C2 after position q. The occurrence of crossover operation depends on the crossover probability Pc. A random number is generated within [0, 1]. If the random value is less than Pc, then the crossover operation is performed, otherwise no crossover is performed (T Liau, 1996).
4.5.6 Mutation
The objective of mutation operation consists in modifying the chromosomes at random. The occurrence of the proposed mutation operation depends on the mutation probability Pm, and as follows: for each string produced by crossover operation, a random value is generated within [0, 1]. If the random number is less than Pm, the 47 mutation operation is performed. A random integer number q’ within [0, 7] called the mutation point is generated. The bit at position q’ is chosen and its value is altered (i.e. one changes 0 to 1, or 1 to 0) (T Liau, 1996).
4.5.7 GA Parameters
The parameters used in distress segmentation are set as follows: the population size is 10, the crossover probability Pc is 0.7, the mutation rate Pm is 0.04, and the number of generations is 150 (Xinren Yu, 2011).
4.5.8 Stopping Criterion
The search can be terminated when there is no significant change between the best fitness values of two successive generations. However, in our case, the process is terminated when the GA has been implemented for 150 times of generations (Xinren Yu, 2011).
The GA procedure described above can be summarized as follows (Xinren Yu, 2011).
- Generate an initial population of 10 chromosomes.
- Store the best chromosome C with the best fitness value.
- Generate the next population by performing selection, crossover and mutation operations.
- Compare the best string C’ of the current population with C. If C’ has a better fitness value than C, then replace C with C’.
- Go to step (1) if the desired number of generations is not reached.
An example of the proposed GA method shown in below Figure 4.13 to Figure 4.16, Figure 4.13 is a sample pavement image. Figure 4.14 shows the image after applying the GA. The pothole area is segmented from the background, as well as some cracks (Xinren Yu, 2011).
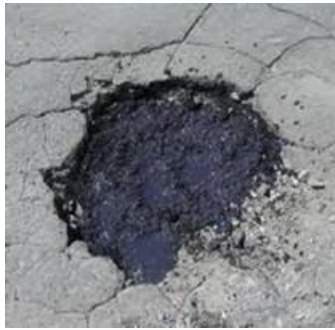
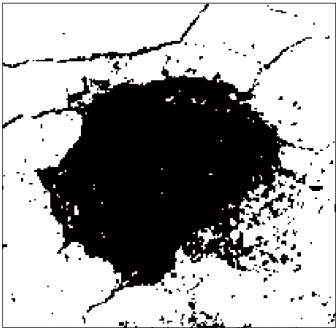
Figure 4.13 Sample pavement image Figure 4.14 Sample pavement image after GA (Xinren Yu, 2011).
Figure 4-15 shows the best threshold value for each generation. The best threshold value converged after 20 generations. Figure 4-16 shows the best fitness value for each generation
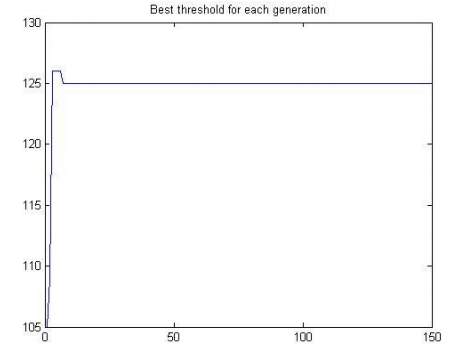
Figure 4.15 Best threshold value for each generation (Xinren Yu, 2011).
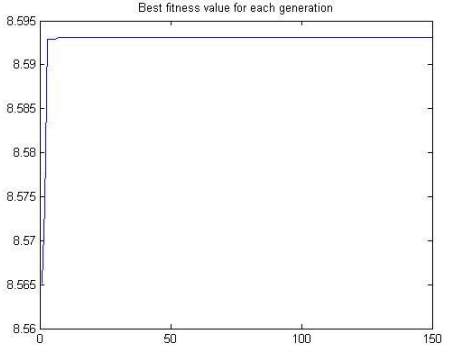
Figure 4.16 Best fitness values for each generation (Xinren Yu, 2011).
4.6 Pavement Distress Classification
Distress extracted through the process as explained above can be classified into different types of cracks (transversal, longitudinal) or potholes. In this chapter, a similar three-layer feed-forward neural network as discussed in the previous chapter is used for distress classification, In this case, three parameters (the vertical distress measure, the horizontal distress measure and the total number of distress tiles) are used to provide the inputs to a feed-forward neural network. The architecture of the neural network which has a total of 3 input nodes, 8 hidden nodes and 3 output nodes is shown in Figure 4.17 (Xinren Yu, 2011).
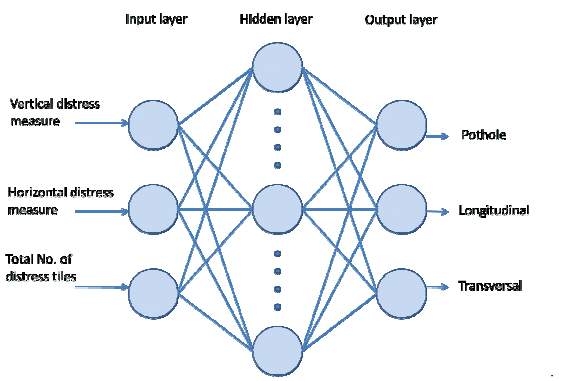
Figure 4.17 Architecture of the proposed neural network (Xinren Yu, 2011).
The distress measures in an image are calculated by accumulating the differences between adjacent histogram, the vertical distress measure is determined by accumulating the differences between the numbers of deformed tiles in adjacent columns and the horizontal distress measure is computed by accumulating the differences between the number of deformation tiles for adjacent image rows. The neural network distinguishes the distress type by finding the unique pattern of uniformity in these distress values.
If the distress is of a transversal crack type, which indicates that there is little deviation between any of the columns for this image and the distress area is small. If the distress is of the longitudinal type crack, the horizontal distress measure and the total number of distress tiles should both have a low value, which indicates that there is little deviation between any of the rows for this image. If both distresses measures and the total number of distress tiles have a large value, the distress is classified as a pothole, which indicates the deviation is significant in both directions and the distress area is large (Xinren Yu, 2011).
Table 4.2 Distress classification guideline B (Xinren Yu, 2011).
| Vertical distress
measure |
Horizontal distress
measure |
Total No. of
Distress tiles |
|
| Pothole | >10 | >10 | >40 |
| Transverse | <5 | >10 | <40 |
| Longitudinal | >10 | <5 | <40 |
An original grayscale pavement image with a longitudinal crack is shown in Figure 4-18. The binary image after segmentation that contains noise is shown in Figure 4-19. The noise points are removed after applying the noise removing method, as shown in Figure 4-20. The small holes of the crack are filled after applying closing operation, as shown in Figure 4-21. The distress tiles distribution with vertical histogram and horizontal histogram is shown in Figure 4.22 (Xinren Yu, 2011).
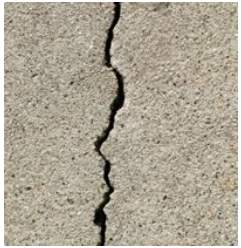
Figure 4.18 Original grayscale pavement Image with a longitudinal crack (Xinren Yu, 2011).
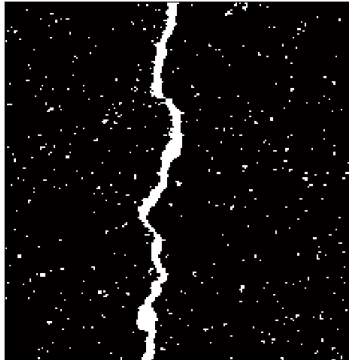
Figure 4.19 Binary Image obtained from the proposed GA (MATLAB R2008b, Xinren Yu, 2011).
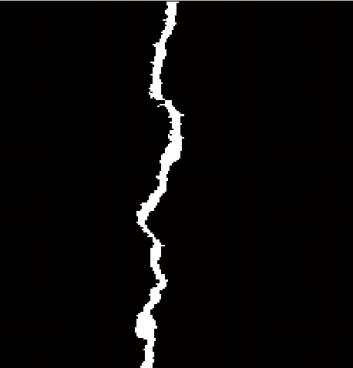
Figure 4.20 Binary Image after removing the noise (MATLAB R2008b, Xinren Yu, 2011).
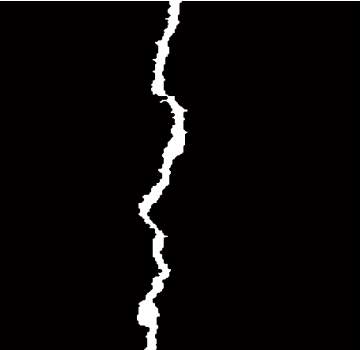
Figure 4.21 Binary Image after closing operation (MATLAB R2008b, Xinren Yu, 2011).
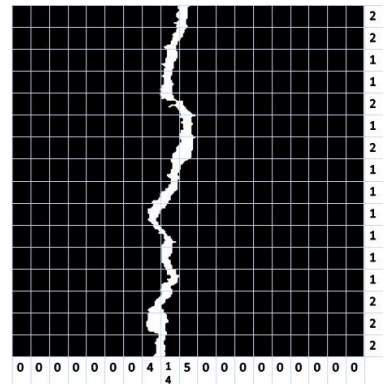
Figure 4.22 Distress tiles distribution (MATLAB R2008b, Xinren Yu, 2011).
According to the data shown in Table 4.2, the distress in Figure 4-18 is classified as a longitudinal crack.
4.7 SIMULATION RESULTS AND ANALYSIS
The proposed algorithms have been implemented in MATLAB R2008b on several digital images taken from the road surface and its performance results are presented in this section. According to the process explained in the previous chapters, the process consists of the following steps: image filtering, thresholding, closing operation, noise removal, laser line deformation detection, pothole estimation and pothole severity and crack type classification (Xinren Yu, 2011).
4.7.1 SIMULATION RESULTS FOR DISTRESS CLASSIFICATION
Figure 4.23 to 4.24 shows some distress reconstruction and classification results extracted from the image database.
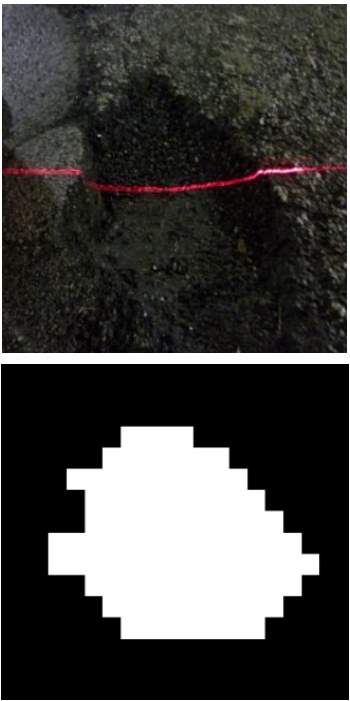
Figure 4.23 Shape estimation and reconstruction result for a pothole (MATLAB R2008b, Xinren Yu, 2011).
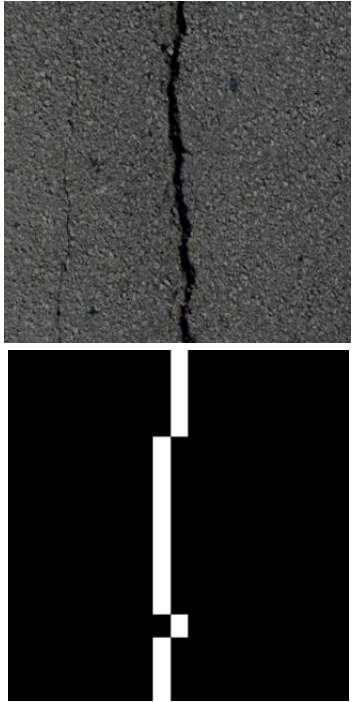
Figure 4.24 Shape estimation and reconstruction result for a longitude crack (MATLAB R2008b, Xinren Yu, 2011).
Table 4.3 Severity level and crack type comparison (Manual vs. Proposed methods) (Xinren Yu, 2011).
| Sam. Distress
No. Type |
Severity level of crack type
Manual Proposed |
Accuracy |
|||
|
Moderate | Moderate | 100 | ||
|
Moderate | Moderate | 100 | ||
|
Longitudinal | Longitudinal | 100 | ||
Table 4.3 summarizes the rating results from manual and proposed laser-based approaches. It can be clearly seen that, in all tested samples, the severity level and the crack type detected by the proposed method is in agreement with the level obtained from the manual method (Xinren Yu, 2011).
A subjective evaluation and comparison of the proposed method and the Otsu’s method is shown in Figure 4-24. Experimental results show that in the samples we tested, the proposed method produced better results for pavement distress segmentation. The left column is the original images. The middle column is the segmentation results obtained from the proposed GA based method, and the right column is the segmentation results obtained from Otsu’s method (Xinren Yu, 2011).
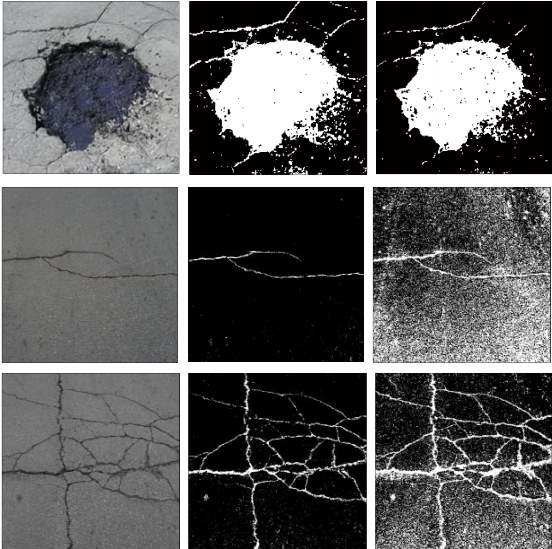
Figure 4.25 Implementation results (MATLAB R2008b, Xinren Yu, 2011).
5. CASE STUDY
In this chapter two case studies are discussed one is with collection of unpaved road condition data using UAV image and the other is with (UAVs) for photogrammetric surveys in rock fall instability studies.
5.1 Case study on Collection of unpaved road condition data using UAV image
This case study, supported by Research and Innovative Technology Administration (RITA), the U.S. Department of Transportation (USDOT Remote Sensing Cooperative Agreement #DTOS59-07-H-0007), It aims to develop a simple yet robust, operational, cost-effective system for maintaining statewide information on the condition of unpaved roads without having to rely on in-situ surveys. The primary thrust of this project is to develop efficient and cost-effective methods for the collection of road condition data. We explore the use of an Unmanned Aerial Vehicle (UAV) as a road data collection platform, and develop efficient methods and systems to process UAV images and identify and quantify road condition parameters such as rutting, potholes, road surface roughness and development of efficient image processing algorithms for automated 3D reconstruction of road surface and measurement of surface distresses (Sokolic et al, 2004).
5.1.1 Algorithms for Image-based Measurement of Surface Distress
One of the key developments in this research is reconstruction of 3D road surface from imagery. Measurements from 2D image along only provide plan metric data. For instance, the depth of potholes, ruts is obtainable only when the 3D road information is available. Other important road geometric properties, such as road slope, cross section geometry can be derived from 3D data. In addition, 3D information also plays an important role in automated detection of road distresses (Zhang, 2003).
The 3D data is achieved from overlapped imagery acquired from UAV and by the developed sophisticated image analysis algorithms using digital photogrammetric technologies. The principle of imaging process and 3D reconstruction from images. Assume a road point A is captured at a1, a2 and a3 in images 1, 2 and 3 respectively from perspectives O1, O2, O3. By reversing the imaging process, point A can be reconstructed three-dimensionally by intersecting image rays O1a1, O2a2, and O3a3 (Zhang, 2003).
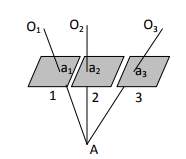
Figure 5.1 Principle of 3D reconstruction from overlapped images. Ground point A is captured at a1, a2 and a3 in images 1, 2 and 3 respectively from perspectives O1, O2, O3. Point A can be reconstructed by the intersection of image rays of O1a1, O2a2, and O3a3 (Zhang, 2003).
Our system necessarily consists of three main steps: 1) camera calibration, 2) image orientation, 3) 3D reconstruction of surface distresses and distress measurement.
5.1.2 Camera Calibration
Camera calibration is necessary for extracting accurate 3D information from images. This topic has been extensively researched in computer vision and photogrammetry (Fraser, 1997; Zhang, 2000; Hartley and Zisserman, 2000; Gruen and Beyer, 2001). The aim of camera calibration is to determine the inner orientation parameters. Several commercial software and open source algorithms for camera calibration are available in the market and the literature. In this research, the camera characteristics are determined via iWitness software (Cronk et al., 2006).
5.1.3 Image Orientation
After acquisition of imagery in a UAV flight mission, the imagery should be accurately orientated before 3D mapping and image-based measurement can be performed. Image orientation involves determination of the position and attitude of each perspective center, this information is necessary for 3D computation by intersection of image rays (Zhang, 2003).
5.1.4 Image Analysis for 3D Reconstruction for Measurement of Surface Distresses
The relative orientation process is first performed using a pair of stereo images and the 3D object space coordinates of conjugate points are then computed via two image intersections. Each time a new image is added, the algorithm locates its’ point features, find their correspondent points in all pervious images, and adds the new set of points in the image as shown in Figure 5.2 block (Zhang, 2003).
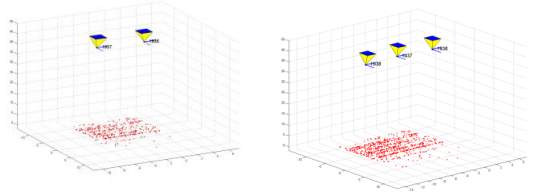
Figure 5.2 3D views of automatic image block formation and image orientation, left shows relative orientation of an image pair. Then, the block is progressively growing by integrating more images (right) until no more images are left. The object space points are shown in red (Zhang, 2003).
The developed image analysis algorithms prove to be robust to process UAV acquired imagery. The major algorithmic development includes integrated sensor orientation, 3D reconstruction and semi-automatic measurement. The sensor orientation approach determines the image orientation parameters fully automatically (Zhang, 2003).
5.2 (UAVs) for photogrammetric surveys in rock fall instability studies.
The study of stability conditions of a rock mass is based on the systematic and quantitative description of discontinuities found therein. Geo structural analysis is traditionally performed with a geological compass with which the dip and dip direction of the joints are directly measured. The application of UAV photogrammetry based on the use of a drone helicopter. The study regards two different geological and geomorphological rock slopes, frequently subject to rock falls, located on the Amalfi Coast (Praiano) and at Cape Posillipo (Naples). In particular, for the cliff of Coroglio (Cape Posillipo, Naples) we present preliminary geo-structural results and compare them with those obtained by direct analysis of the cliff face and from less detailed photogrammetric surveys from a helicopter (Mariella Danzi, 2012).
5.2.1 UAV photogrammetric survey
Micro & Mini UAV systems (M-class) are equipped with low-cost navigation sensors like GPS/INS and have the capability to fly completely autonomously or with a predefined flight path (EISENBEISS, 2009). In this system, a drone (Fig. 5.3 A) consists in remote-controlled 4-8 rotors that make it easy to change direction during the flight. The drone also has a camera capable of making videos and taking high-resolution photos. A GPS and an altimeter record in real time the precise position, altitude and also the distance from the cliff. The possibility of flying very close to the cliff (sometimes as little as 10 m away) enables important geostructural observations and also helps recognize open fractures parallel to the rock cliff not easily identified by TLS or manned systems (helicopter) (Fig.5.3 B).
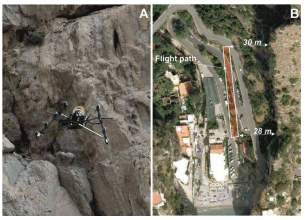
Figure 5.3 a) Drone and calibrated camera along the “Praiano” gorge b) distance of the drone flight path from the rock cliff (Mariella Danzi, 2012).
5.2.2 Application of UAV photogrammetry
Two different surveys were carried out, the first on the Amalfi coast, along the narrow gorge of Praiano cut into the limestone rocks (Fig. 1), the second at “Coroglio” in Naples, along the 150-meter high cliffs of “Cape Posillipo”. In the case of Coroglio the flight plan was programmed by dedicated software through a 70% longitudinal overlap and a 50% cross; in the case of the Praiano gorge, For the absolute orientation of the stereoscopic models we used coordinates of control points acquired by a topographic survey. Targets in forex were positioned along the Coroglio cliff while in Praiano a topographic survey of natural points and those subject to human impact was done to calculate their precise coordinates. In the latter case the photogrammetric survey is undoubtedly less expensive (Ferroeo et alii, 2011).
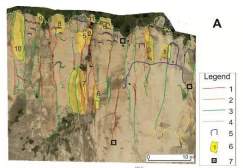
Figure 5.4 Photo by drone of Coroglio cliff, georeferenced on the photogrammetric survey (Mariella Danzi, 2012).
The results from this analysis (UAV-DTP) were compared with those obtained by helicopter photogrammetric survey complementary to engineering-geological survey (DTP). Use of an unmanned Aerial vehicle (UAV) is a good terrestrial photogrammetric procedure to reduce operating costs and speed up the external acquisition phases. The procedure described above provides a very powerful tool for rock slope stability analysis, and is able to supply detailed information about discontinuities and slope geometry, even on high cliffs otherwise unattainable by direct measurements. The UAV-DTP system presents the following advantages: high versatility of use in different topographic contexts like high cliffs, narrow gorges or very urbanized areas; high geometric accuracy related to the possibility of drones flying in the vicinity (up to a few meters away) of the cliff. Data from UAV-DTP can be represented on orthophotos and 3D models integrated in a GIS (Mariella Danzi, 2012).
Cite This Work
To export a reference to this article please select a referencing stye below:
Related Services
View all


Related Content
All TagsContent relating to: "Aviation"
Aviation regards any activity involved in the aircraft industry or mechanical flight including flying and the design, manufacture, and maintenance of aircraft. The term “aircraft” includes such vehicles as aeroplanes, helicopters, and lighter than air craft such as hot air balloons and airships.
Related Articles
DMCA / Removal Request
If you are the original writer of this dissertation and no longer wish to have your work published on the UKDiss.com website then please: